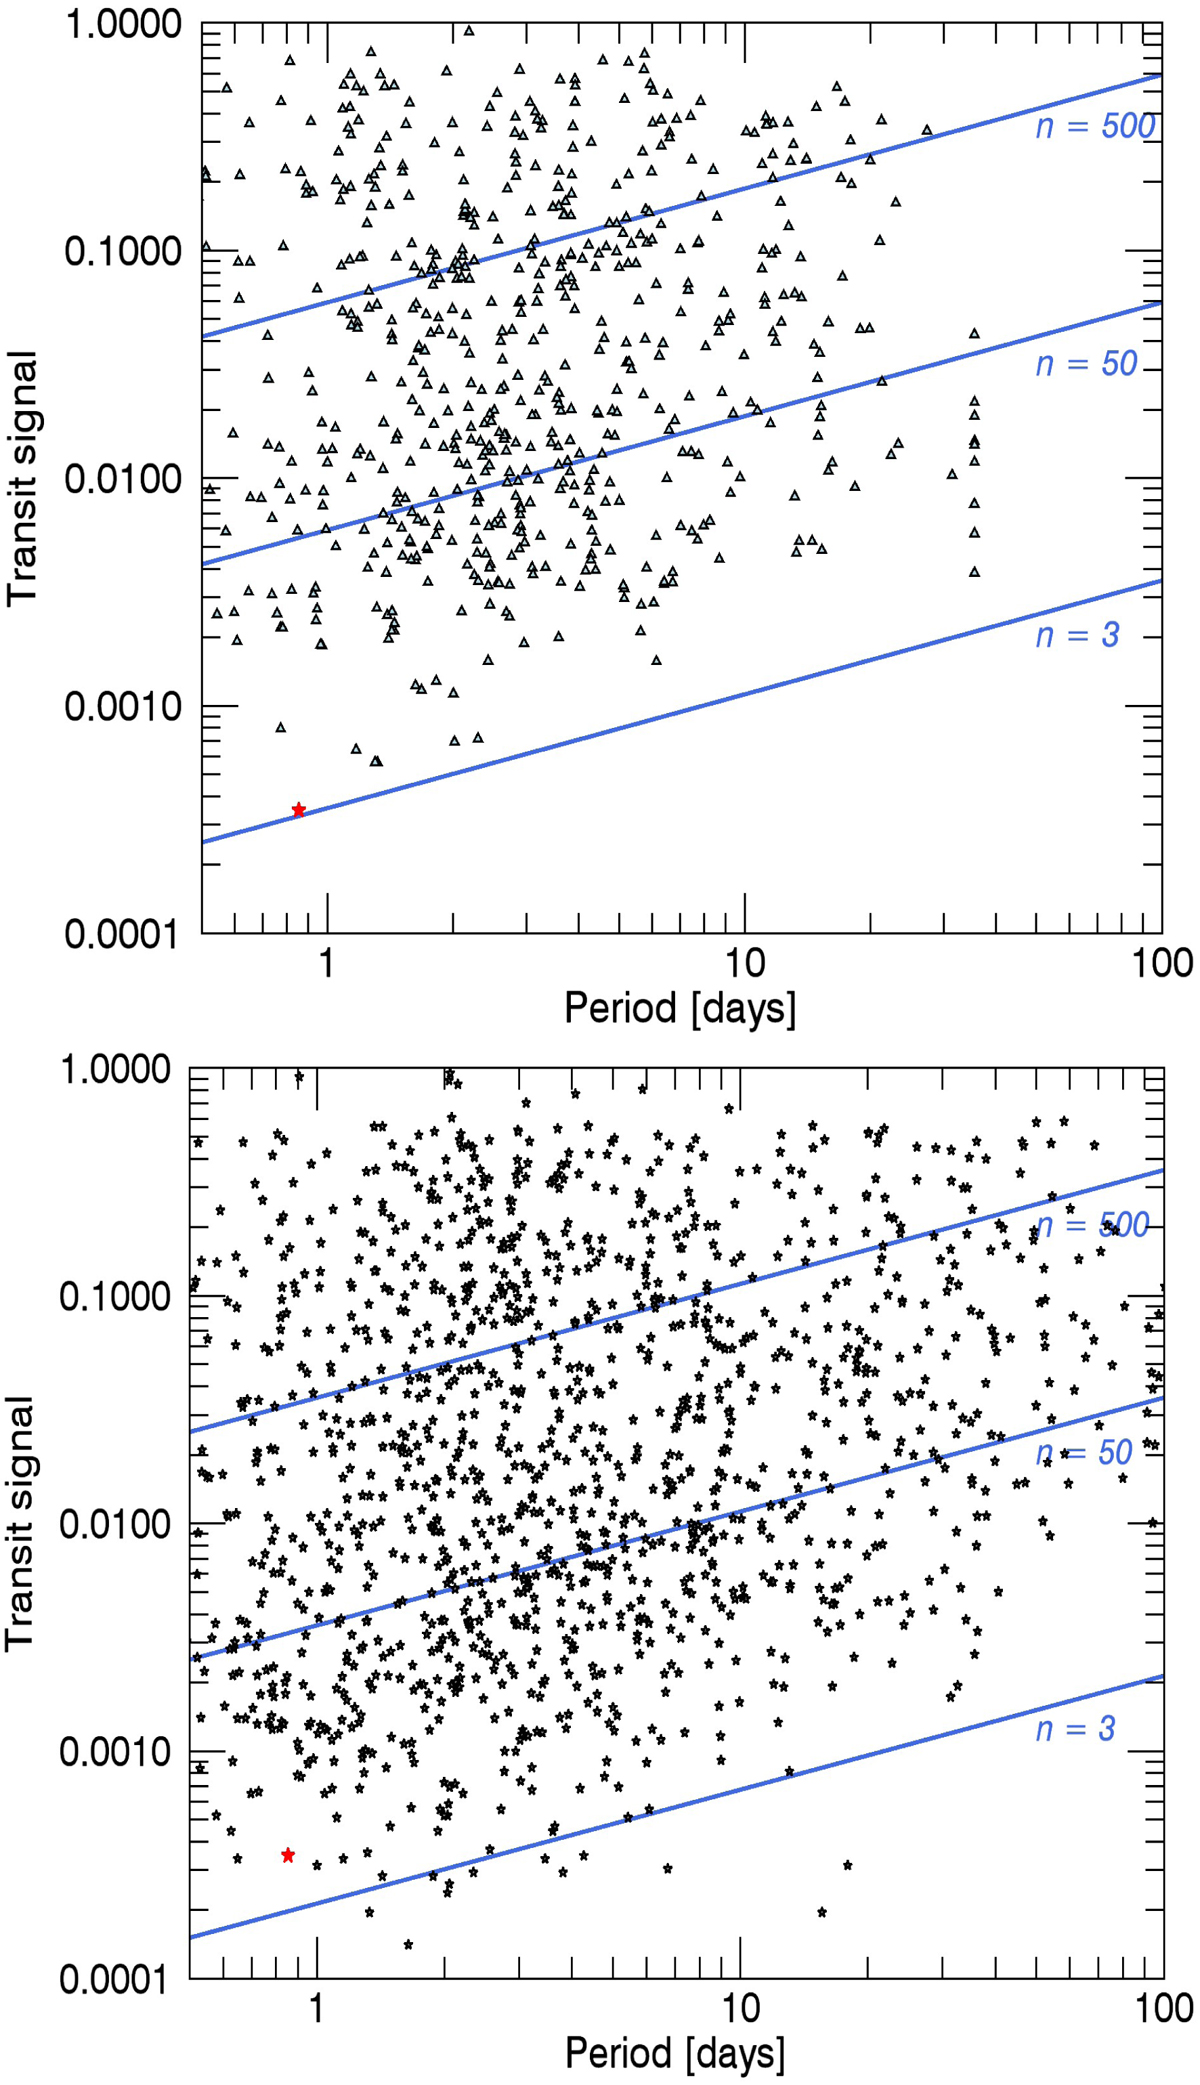
Fig. 12.

Transit signal as a function of the period of all candidates and EB in fields whose duration was less than 40 days (top) and those whose duration was greater than 80 days (bottom). The plain blue lines show the expected transit S/N for three different noise levels (given by the n values). The position of CoRoT-7b is indicated by the red star.
Current usage metrics show cumulative count of Article Views (full-text article views including HTML views, PDF and ePub downloads, according to the available data) and Abstracts Views on Vision4Press platform.
Data correspond to usage on the plateform after 2015. The current usage metrics is available 48-96 hours after online publication and is updated daily on week days.
Initial download of the metrics may take a while.


