Fig. 9.
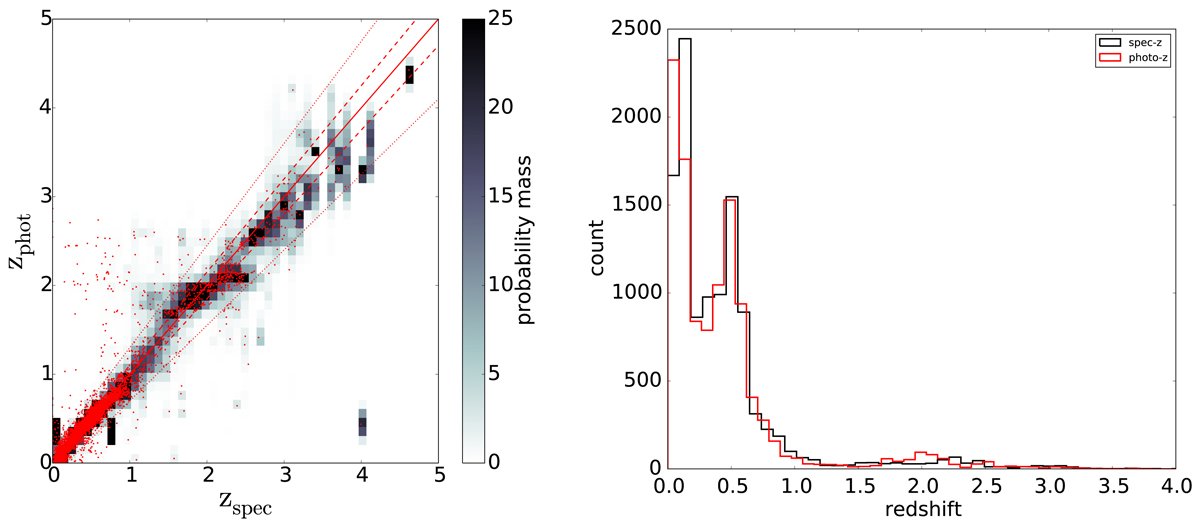
Left: histogram of stacked PDFs of the final sample. The solid line shows the diagonal, the dashed and dotted lines mark the |zphot − zspec|/(1 + zspec) = 0.05, 0.15 respectively. The red dots show the point estimate of the photometric redshifts, here the mode of the PDF. Right: comparison of the photometric (red) and spectroscopic (black) redshift distributions.
Current usage metrics show cumulative count of Article Views (full-text article views including HTML views, PDF and ePub downloads, according to the available data) and Abstracts Views on Vision4Press platform.
Data correspond to usage on the plateform after 2015. The current usage metrics is available 48-96 hours after online publication and is updated daily on week days.
Initial download of the metrics may take a while.