Fig. 3.
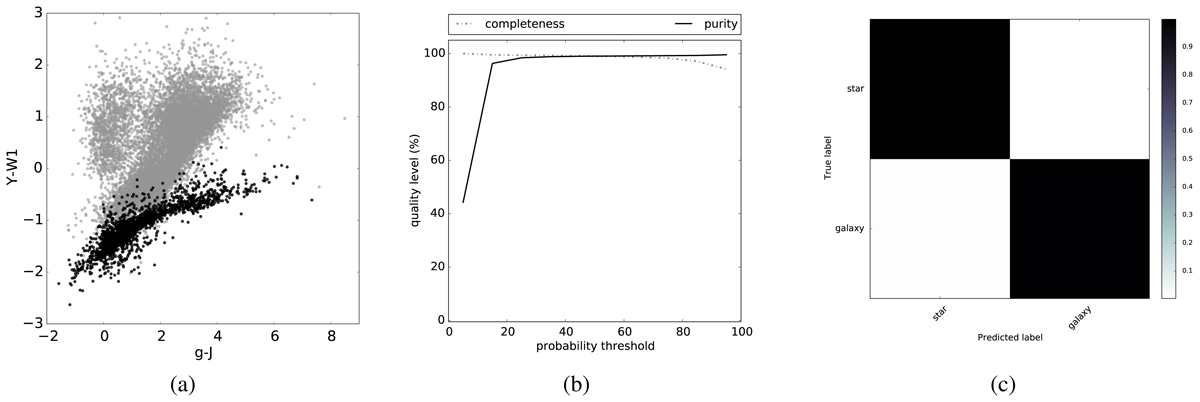
Stars identified in the test sample. Panel a: color locus occupied by the stars (black points) compared to the color locus occupied by the non-stars, i.e. galaxies and AGN (gray points) adopting a probability threshold of 50%. Panel b: completeness (gray dot-dashed line) and purity (black solid line) of the identified star sample for each given probability threshold given on the x-axis. Panel c: summary of the performance of the classifier in a confusion matrix.
Current usage metrics show cumulative count of Article Views (full-text article views including HTML views, PDF and ePub downloads, according to the available data) and Abstracts Views on Vision4Press platform.
Data correspond to usage on the plateform after 2015. The current usage metrics is available 48-96 hours after online publication and is updated daily on week days.
Initial download of the metrics may take a while.