Fig. 2.
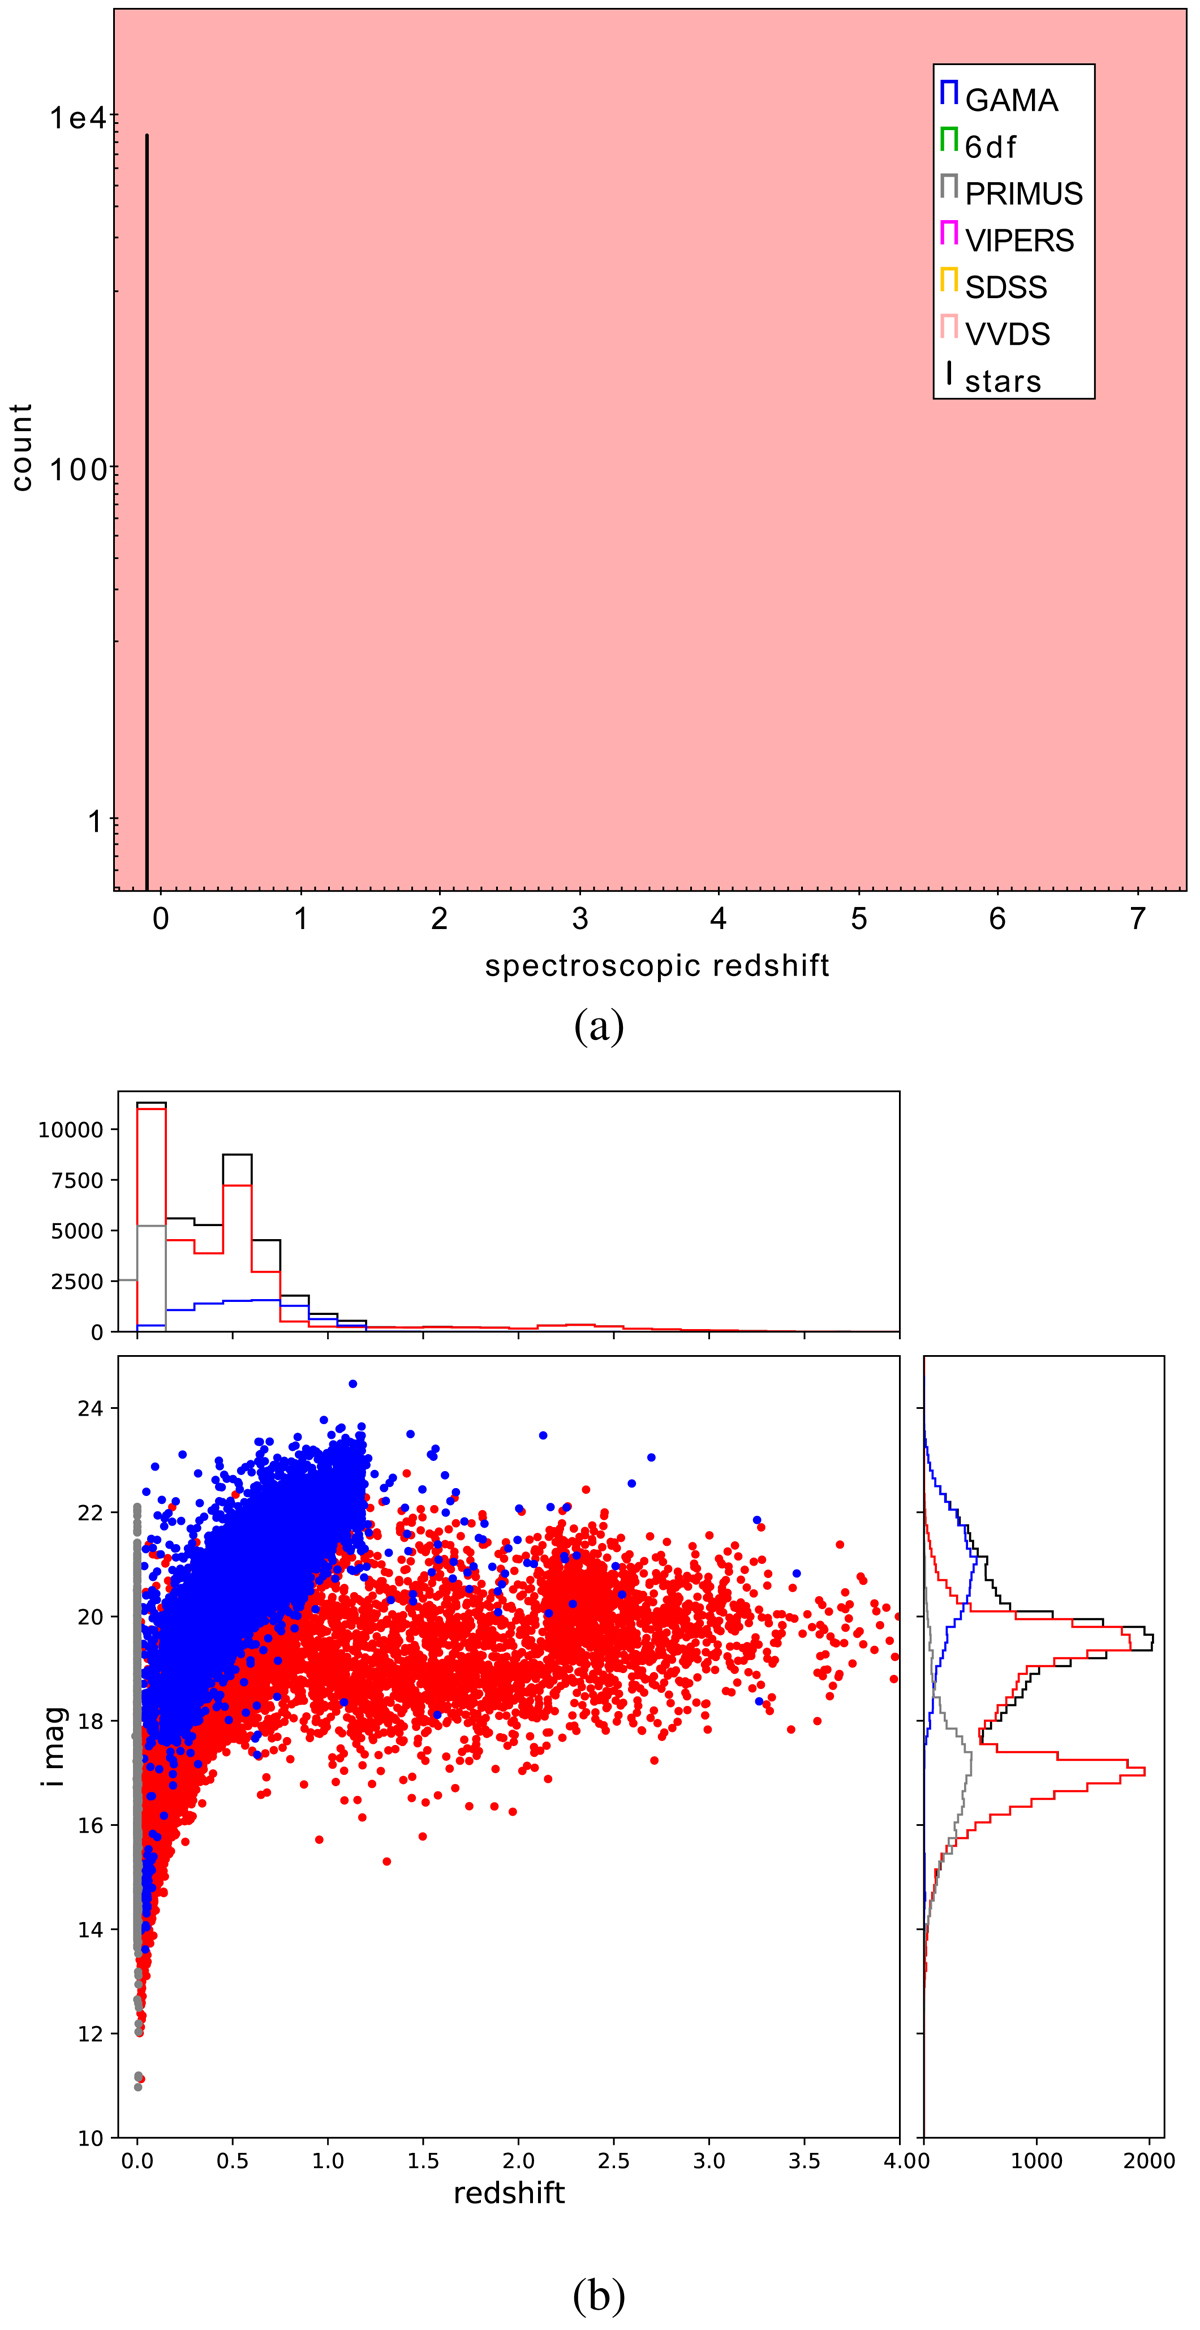
Spectroscopic redshift distribution of the u − k − IR sample used in this work. Panel a: gray shaded area shows the total sample while the colored lines show the survey of origin. The black spike located for clarity at z = −0.1 shows the number of stars in the sample. Panel b: Magnitude distribution for SDSS (red) and CFHTLS (blue) surveys comprising 80% and 20% of the galaxy sample respectively. The stars are shown with grey colour on this plot.
Current usage metrics show cumulative count of Article Views (full-text article views including HTML views, PDF and ePub downloads, according to the available data) and Abstracts Views on Vision4Press platform.
Data correspond to usage on the plateform after 2015. The current usage metrics is available 48-96 hours after online publication and is updated daily on week days.
Initial download of the metrics may take a while.