Free Access
Fig. 3.
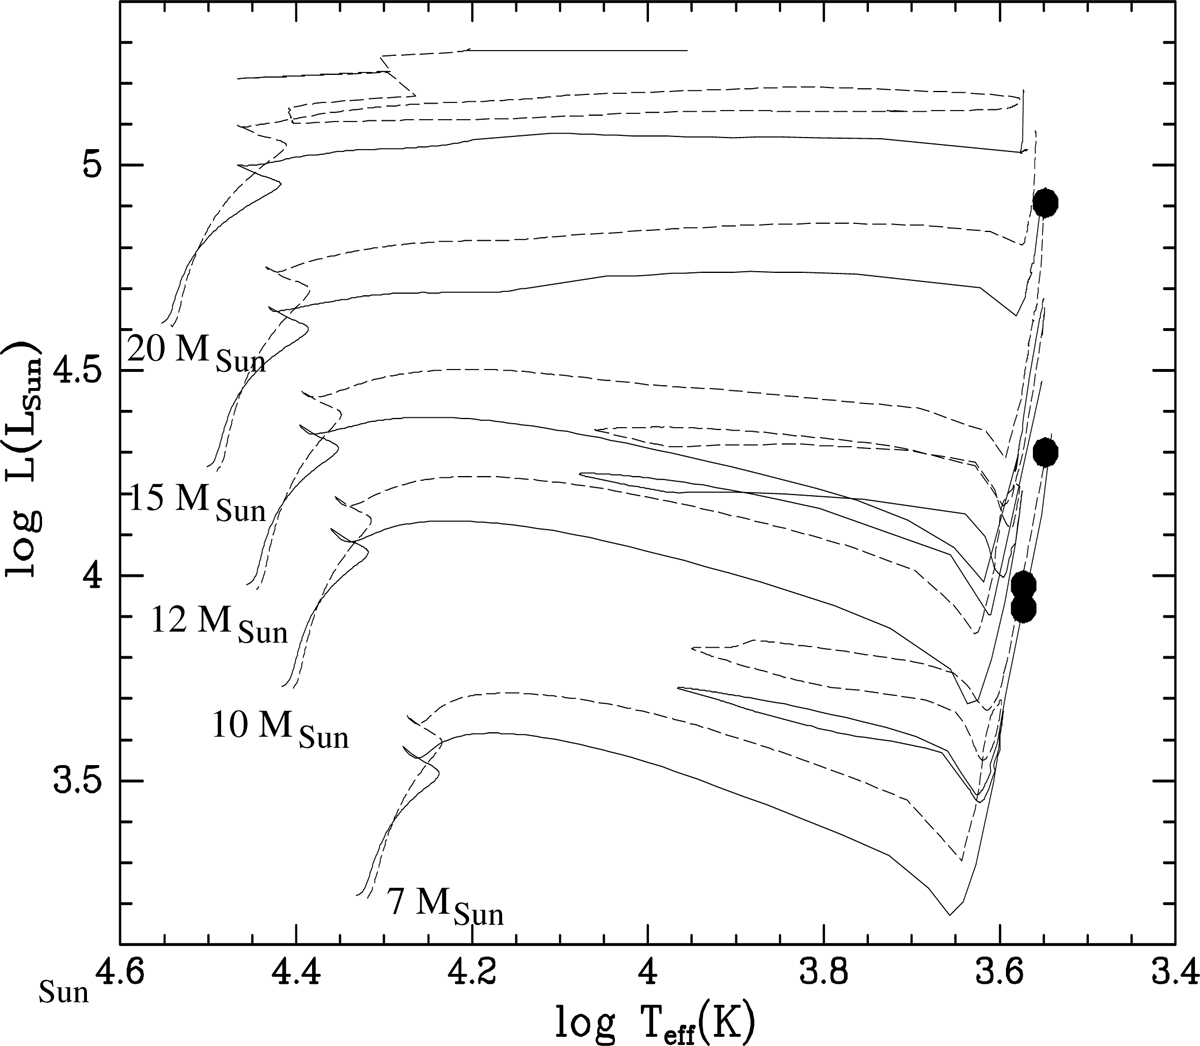
Position of the four red supergiants on the temperature–luminosity diagram. The Geneva evolutionary tracks (Ekström et al. 2012) are plotted for stars with different initial masses, both non-rotating (solid lines) and rotating with a velocity 40% of the critical velocity.
Current usage metrics show cumulative count of Article Views (full-text article views including HTML views, PDF and ePub downloads, according to the available data) and Abstracts Views on Vision4Press platform.
Data correspond to usage on the plateform after 2015. The current usage metrics is available 48-96 hours after online publication and is updated daily on week days.
Initial download of the metrics may take a while.