Fig. A.1.
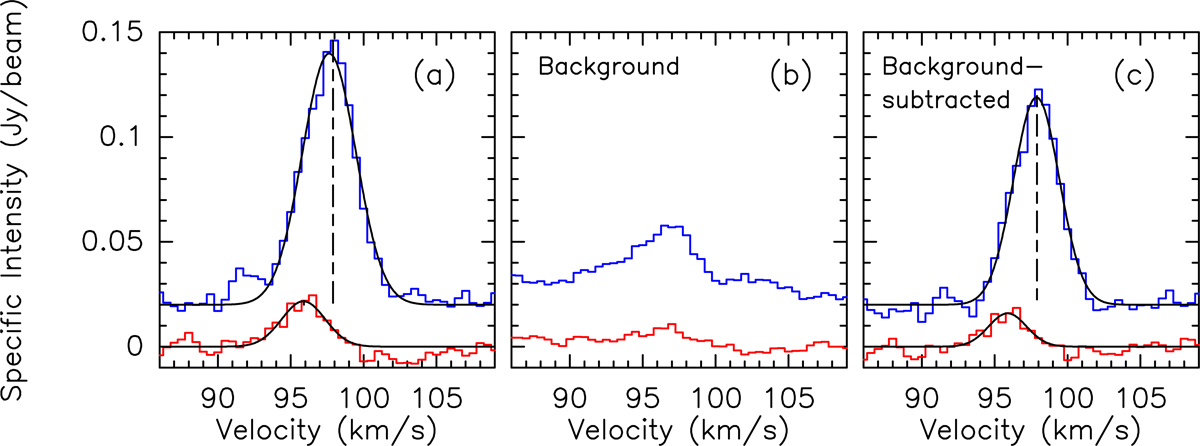
Spectra of the 13CS line detected toward the continuum peak of core #3 (in blue with a 0.02 Jy beam−1 offset) and core #6 (in red), before (panel a) and after (panel c) subtraction of their parental filament and outflow emission (panel b). Black curves are the Gaussian fits used to measure the line widths of the cores: ΔV13CS = 4.3 km s−1 and 3.7 km s−1 for core #3, ΔV13CS = 3.5 km s−1 and 3.1 km s−1 for core #6 before and after background subtraction, respectively.
Current usage metrics show cumulative count of Article Views (full-text article views including HTML views, PDF and ePub downloads, according to the available data) and Abstracts Views on Vision4Press platform.
Data correspond to usage on the plateform after 2015. The current usage metrics is available 48-96 hours after online publication and is updated daily on week days.
Initial download of the metrics may take a while.