Free Access
Fig. 6.
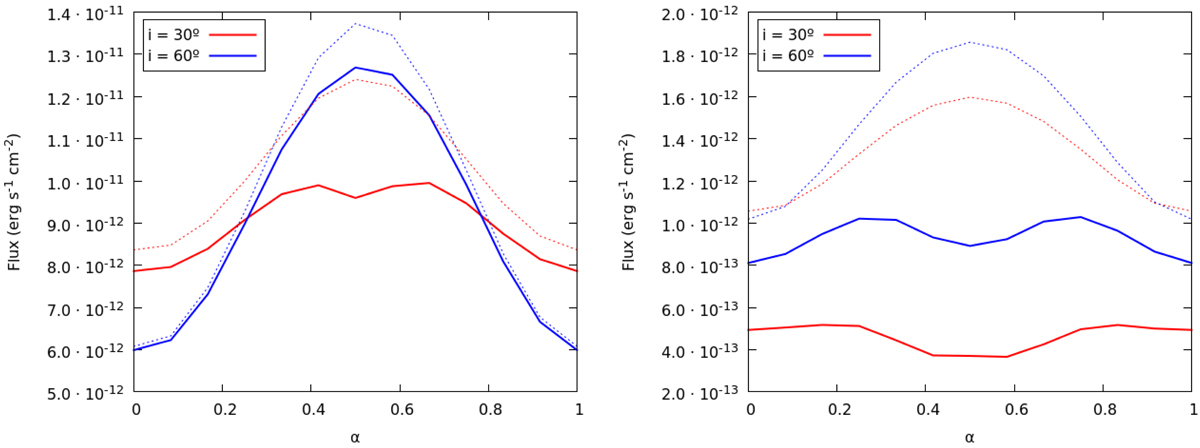
Light curves of IC emission (jet + counter-jet) at 0.1–100 GeV (left panel) and > 100 GeV (right panel), for i = 30° (red lines) and 60° (blue lines), and ηB = 10−2. The unabsorbed light curves are also shown (dotted lines). The CO is in inferior (superior) conjunction with the star when the orbital phase is 0 (0.5).
Current usage metrics show cumulative count of Article Views (full-text article views including HTML views, PDF and ePub downloads, according to the available data) and Abstracts Views on Vision4Press platform.
Data correspond to usage on the plateform after 2015. The current usage metrics is available 48-96 hours after online publication and is updated daily on week days.
Initial download of the metrics may take a while.