Free Access
Fig. 8.
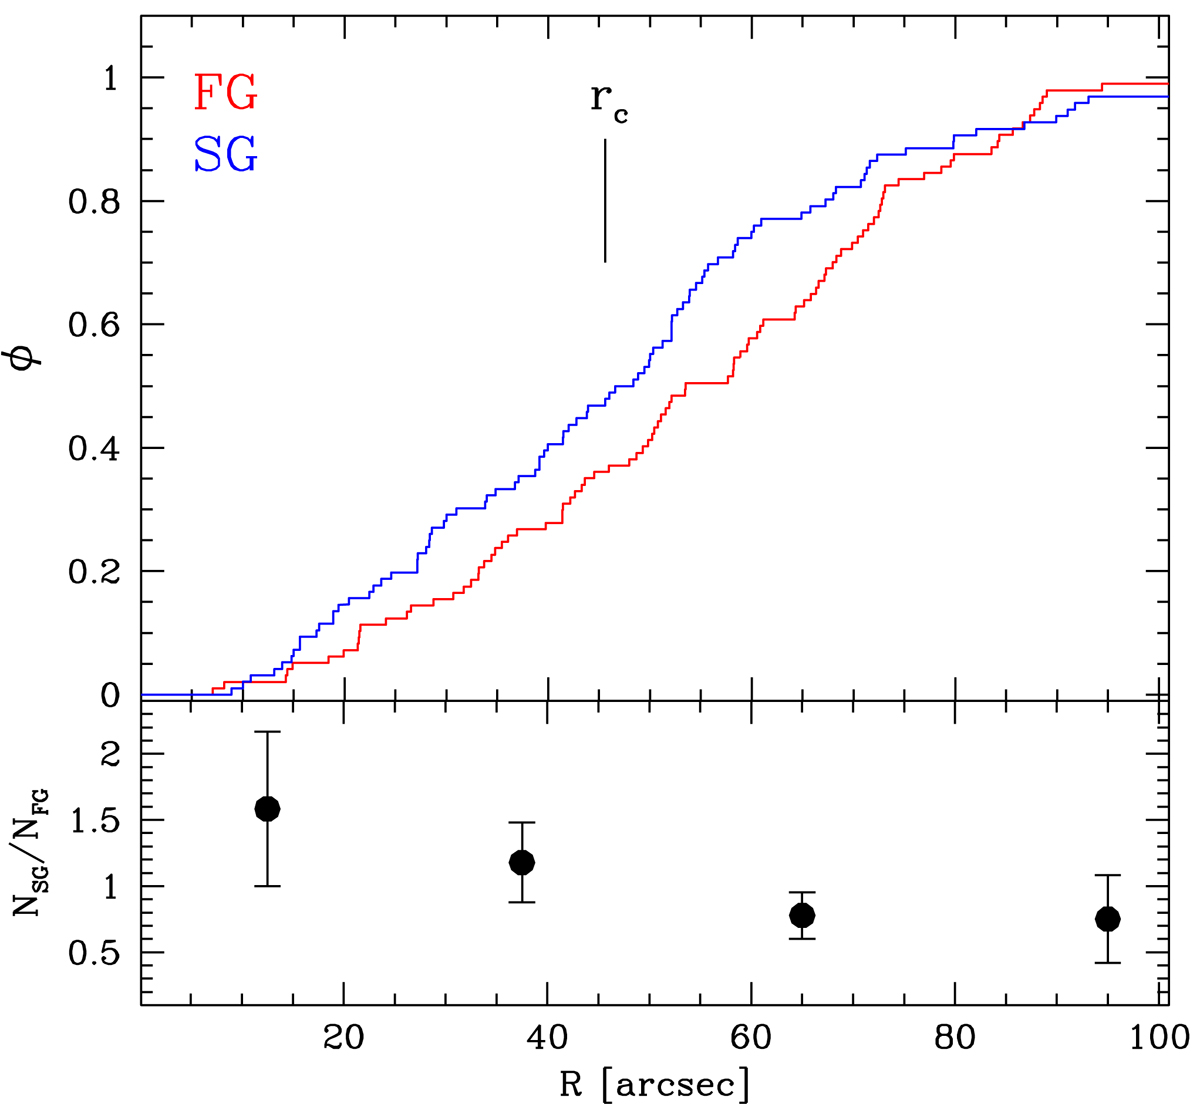
Upper panel: cumulative radial distribution of FP (red), and SP (blue) stars. Lower panel: ratio between SP and FP stars as a function of the distance from the cluster centre. The position of the core radius (rc) is also shown.
Current usage metrics show cumulative count of Article Views (full-text article views including HTML views, PDF and ePub downloads, according to the available data) and Abstracts Views on Vision4Press platform.
Data correspond to usage on the plateform after 2015. The current usage metrics is available 48-96 hours after online publication and is updated daily on week days.
Initial download of the metrics may take a while.