Free Access
Fig. 7.
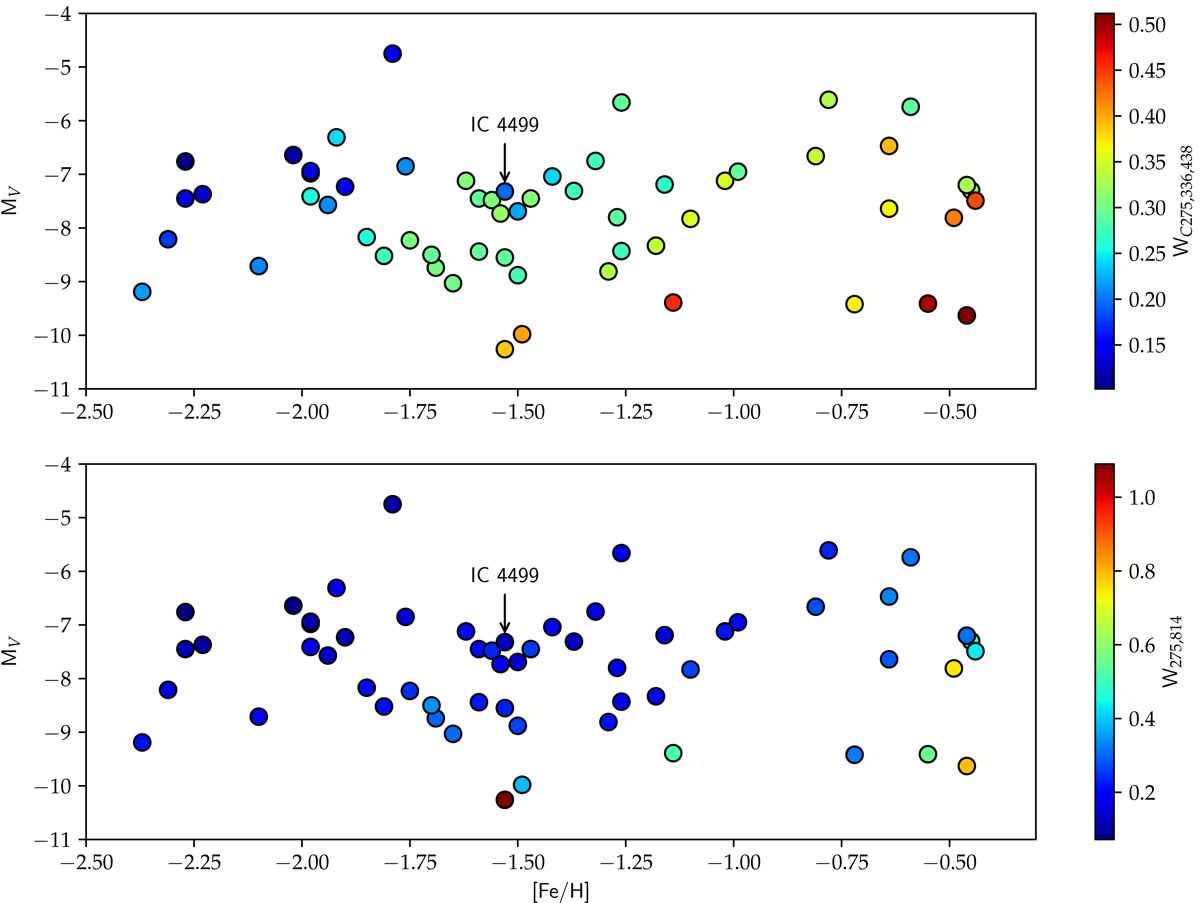
Metallicity vs. integrated V magnitude distribution of GCs observed within the HST UV Legacy Survey. Clusters are colour coded according to the values of WC(275,336,438) (top panel) and W275,814 (bottom panel). IC 4499 is highlighted in both plots.
Current usage metrics show cumulative count of Article Views (full-text article views including HTML views, PDF and ePub downloads, according to the available data) and Abstracts Views on Vision4Press platform.
Data correspond to usage on the plateform after 2015. The current usage metrics is available 48-96 hours after online publication and is updated daily on week days.
Initial download of the metrics may take a while.