Fig. 5.
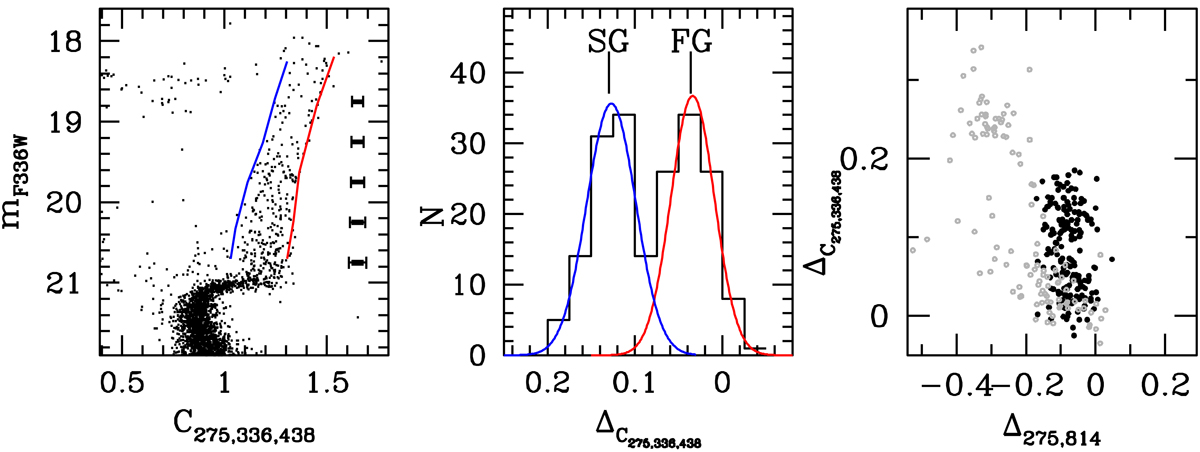
Left panel: (mF336W, C275,336,438) pseudo-colour diagram of IC 4499. Typical photometric errors for different magnitude bins are also shown. Middle panel: verticalised pseudo-colour distribution ΔC275,336,438 of RGB stars in the magnitude range 18.2 < mF336W < 20.5. Two main components can be clearly identified (SP and FP, in blue and red; respectively). Right panel: (Δ275,814, ΔC275,336,438) colour-colour diagram (“chromosome map”) of IC 4499. Overplotted for reference is shown also the chromosome map of NGC 288 (light grey).
Current usage metrics show cumulative count of Article Views (full-text article views including HTML views, PDF and ePub downloads, according to the available data) and Abstracts Views on Vision4Press platform.
Data correspond to usage on the plateform after 2015. The current usage metrics is available 48-96 hours after online publication and is updated daily on week days.
Initial download of the metrics may take a while.