Free Access
Fig. 1.
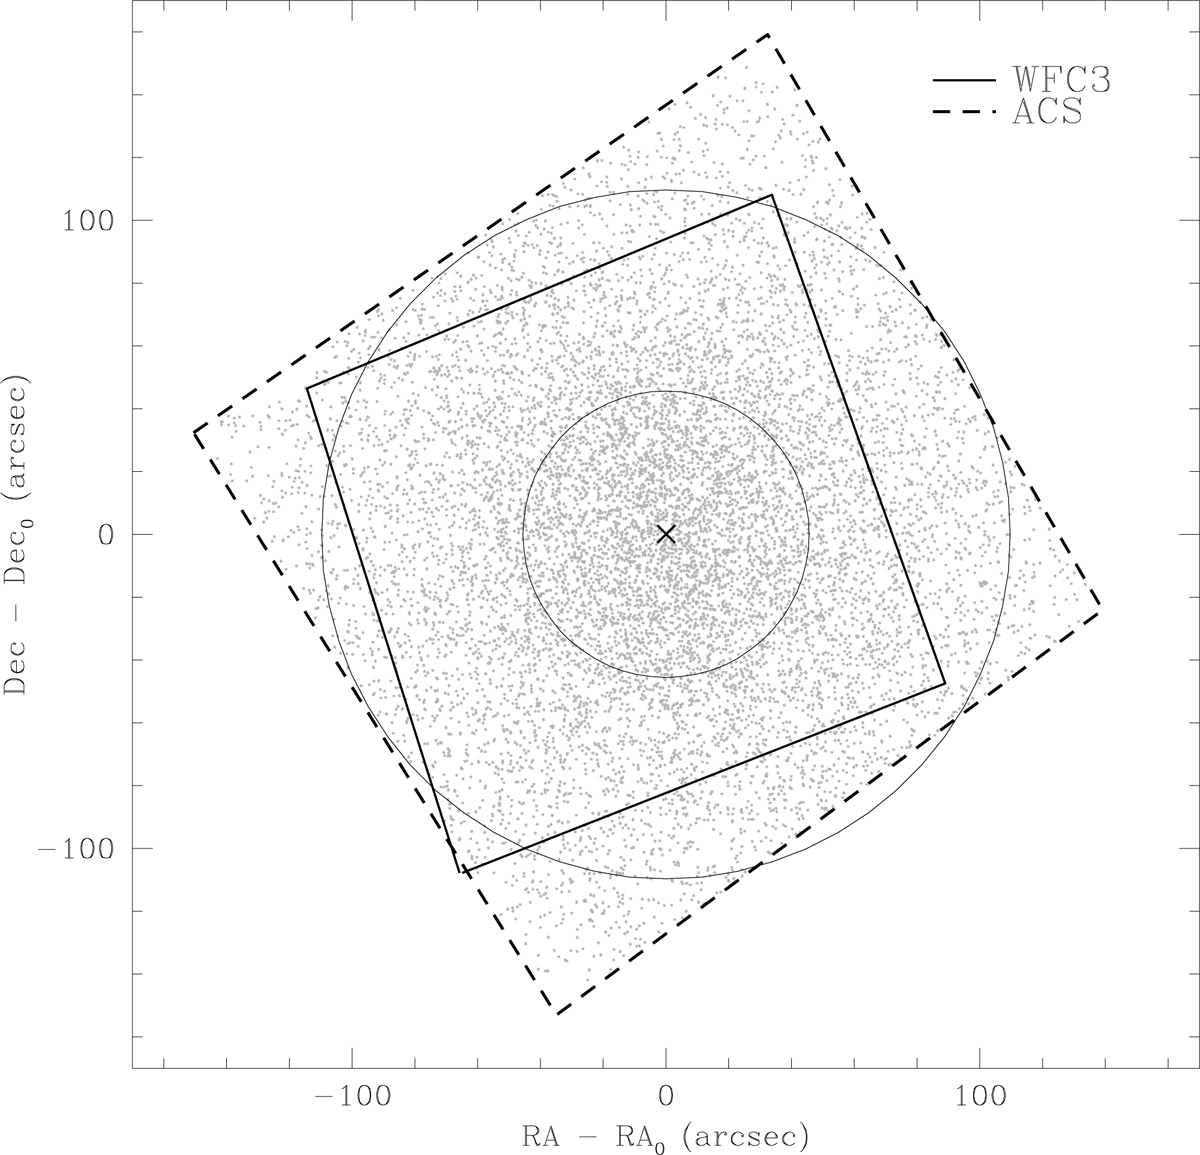
Map of the HST/WFC3 and HST/ACS images FOVs. The two black circles represent the cluster core and half mass radii from Harris (1996).
Current usage metrics show cumulative count of Article Views (full-text article views including HTML views, PDF and ePub downloads, according to the available data) and Abstracts Views on Vision4Press platform.
Data correspond to usage on the plateform after 2015. The current usage metrics is available 48-96 hours after online publication and is updated daily on week days.
Initial download of the metrics may take a while.