Fig. 8
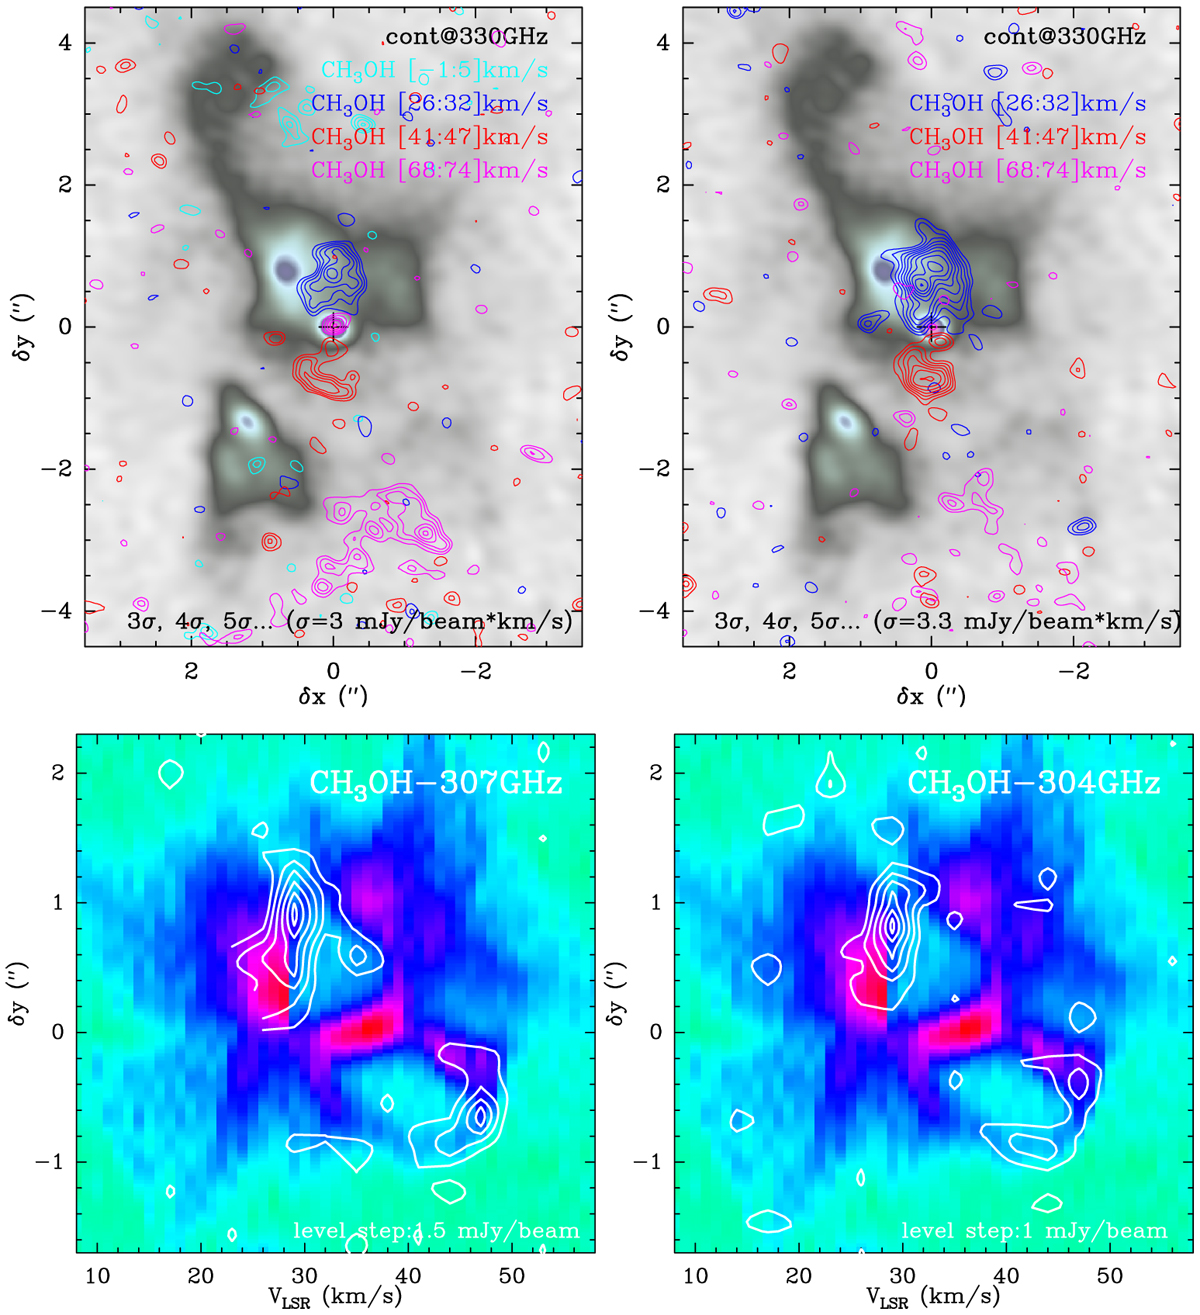
CH3OH line emissiontowards OH 231.8, transitions at 307.166 GHz (Eup = 38 K) and 304.208 GHz (Eup = 21.6 K). Top: integrated intensity maps over the VLSR ranges where emission is detected (indicated inside the boxes) overimposed on the 330 GHz-continuum map. Bottom: axial PV diagram of CH3OH (white contours) on top of 13CO (J = 3–2) for comparison (color-scale).
Current usage metrics show cumulative count of Article Views (full-text article views including HTML views, PDF and ePub downloads, according to the available data) and Abstracts Views on Vision4Press platform.
Data correspond to usage on the plateform after 2015. The current usage metrics is available 48-96 hours after online publication and is updated daily on week days.
Initial download of the metrics may take a while.