Free Access
Fig. 9.
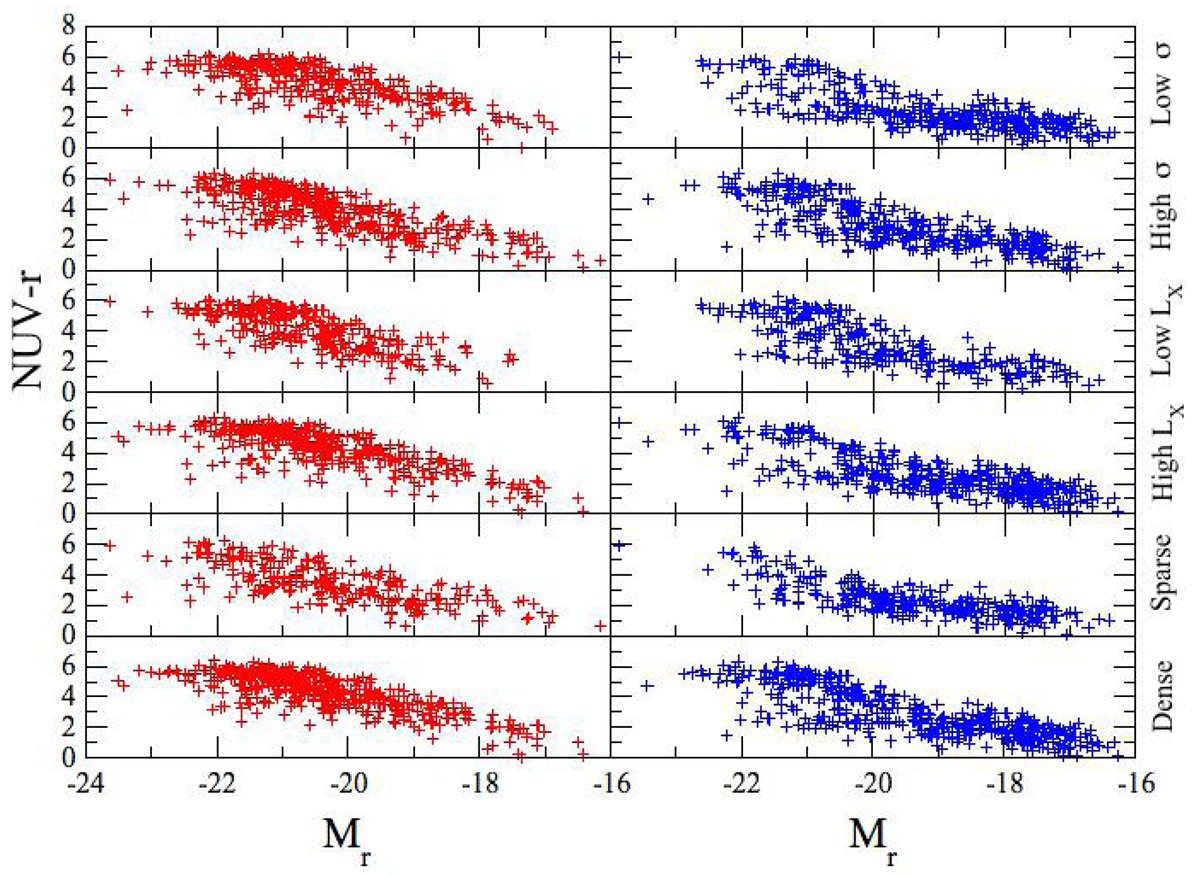
Colour-magnitude diagrams in NUV − r vs. Mr for optically red (red symbols, left panels) and blue (blue symbols, right panels) galaxies in each of the cluster subsamples we consider, as indicated in the legend to the right of each subpanel. Note that the sample is selected in NUV and is therefore not complete in r.
Current usage metrics show cumulative count of Article Views (full-text article views including HTML views, PDF and ePub downloads, according to the available data) and Abstracts Views on Vision4Press platform.
Data correspond to usage on the plateform after 2015. The current usage metrics is available 48-96 hours after online publication and is updated daily on week days.
Initial download of the metrics may take a while.