Fig. 7.
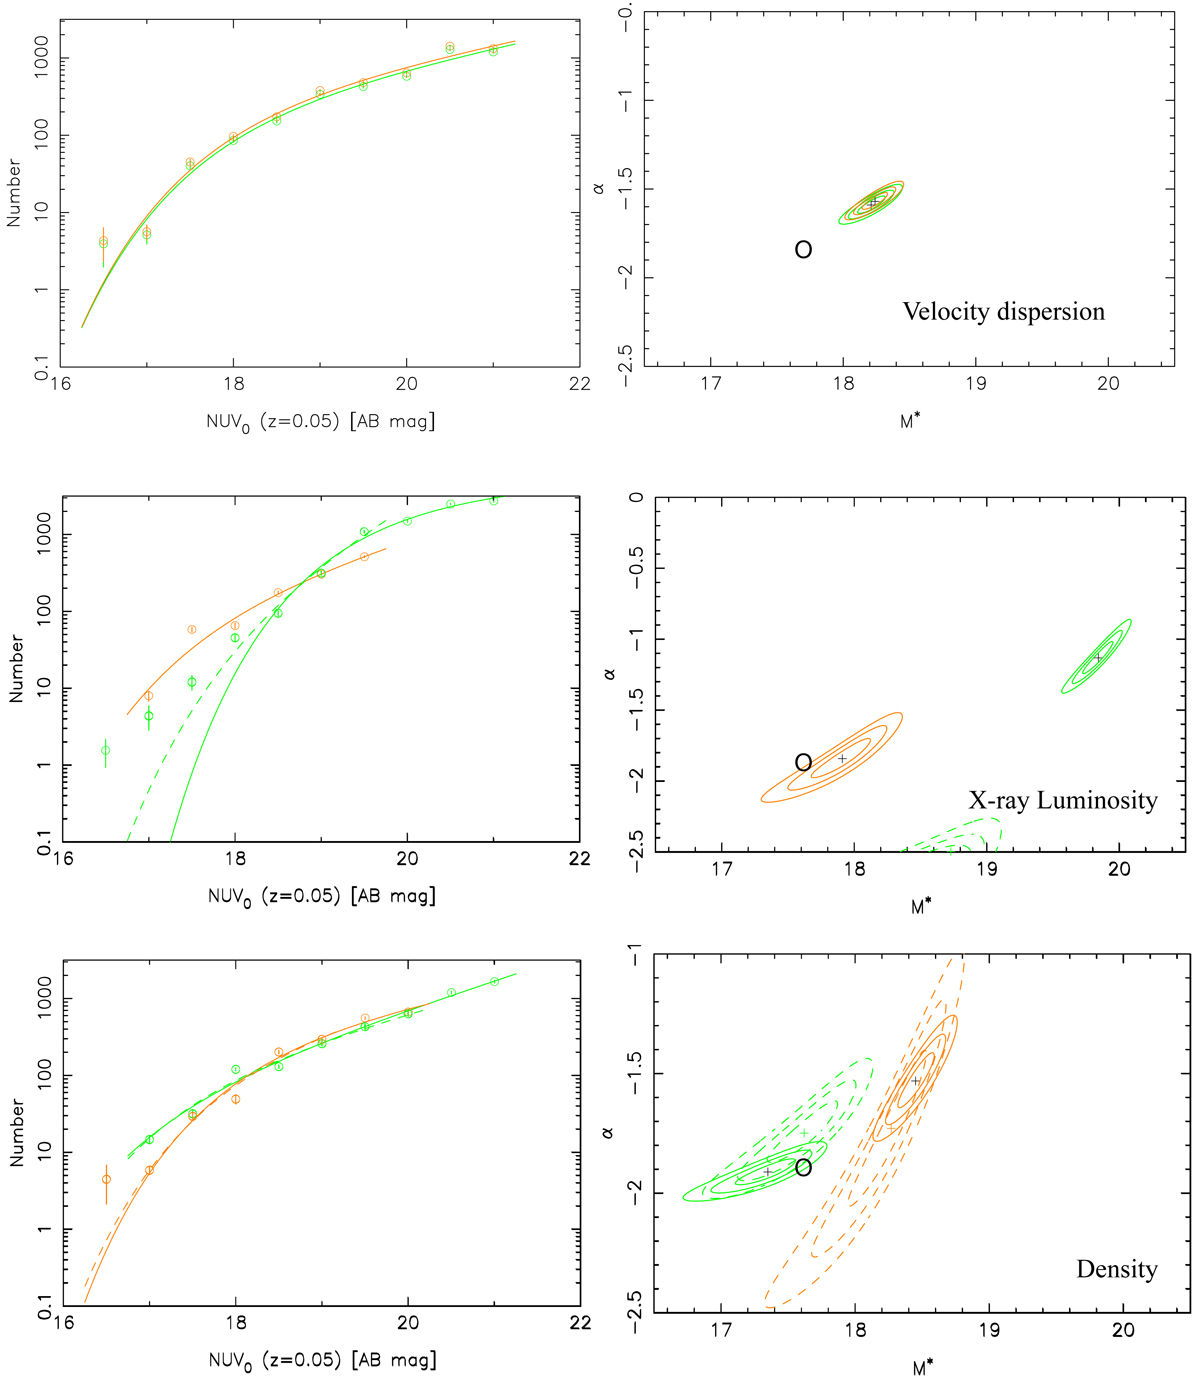
Luminosity functions and best fits left column) and associated error ellipse (right column) for low (orange) and high (green) σ clusters (top row), low (orange) and high (green) LX clusters (middle row) and sparse (orange) and dense (green) clusters (bottom row). The circle in each figure indicates the M* and α values for the total LF. Clearly, for the subsamples split by X-ray luminosity and surface density, the luminosity distributions as sampled here are not well fitted by Schechter functions, the location and size of the error ellipses in these cases should be used with caution. Any interpretation should take note of the actual numbers rather than the fits to the data. The continuous lines and contours are the fits to the entire range of NUV0 values available for a given subsample. The dashed lines and contours are for Schechter fits restricted in range in NUV0 where both subsamples have data. Clearly, in the case of splitting by Lx, even this does not result in a good fit for the high Lx subsample, though obviously the data imply a lower ratio of high to low LUV galaxies in the high Lx subsample relative to that of the low Lx subsample. For the split by surface density, restricting the fitting range has no real effect.
Current usage metrics show cumulative count of Article Views (full-text article views including HTML views, PDF and ePub downloads, according to the available data) and Abstracts Views on Vision4Press platform.
Data correspond to usage on the plateform after 2015. The current usage metrics is available 48-96 hours after online publication and is updated daily on week days.
Initial download of the metrics may take a while.