Free Access
Fig. 6.
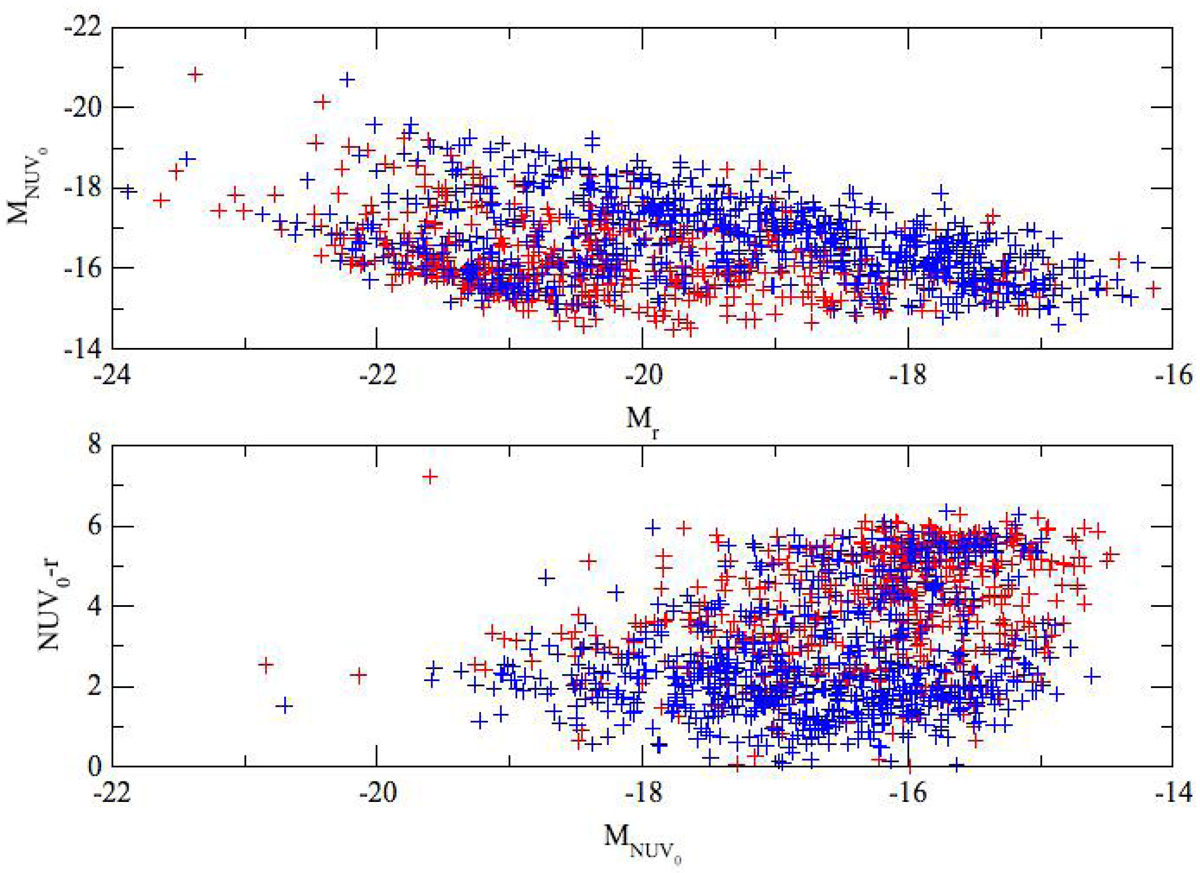
For all galaxies in all clusters we plot the absolute magnitudes in r vs. the absolute magnitudes in NUV on the top panel. Red symbols are for red sequence galaxies and blue symbols for blue cloud galaxies. On the bottom panel we show the NUV-r colours as a function of absolute NUV magnitude.
Current usage metrics show cumulative count of Article Views (full-text article views including HTML views, PDF and ePub downloads, according to the available data) and Abstracts Views on Vision4Press platform.
Data correspond to usage on the plateform after 2015. The current usage metrics is available 48-96 hours after online publication and is updated daily on week days.
Initial download of the metrics may take a while.