Free Access
Fig. 5.
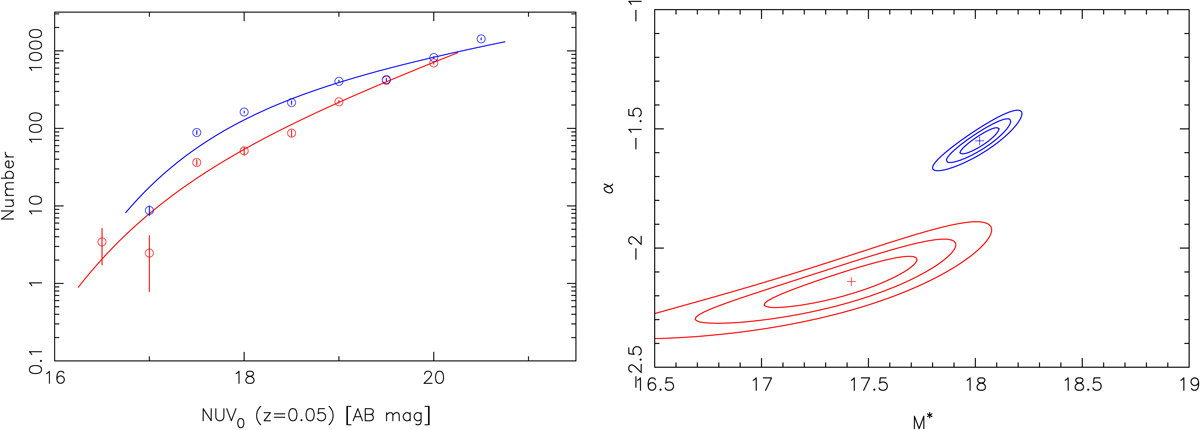
Luminosity function and best fit for red and blue galaxies (identified by colour) for all clusters in the sample (left). Error ellipses for 1, 2 and 3σ are shown in the right-hand panel, for red and blue galaxies.
Current usage metrics show cumulative count of Article Views (full-text article views including HTML views, PDF and ePub downloads, according to the available data) and Abstracts Views on Vision4Press platform.
Data correspond to usage on the plateform after 2015. The current usage metrics is available 48-96 hours after online publication and is updated daily on week days.
Initial download of the metrics may take a while.