Fig. 5.
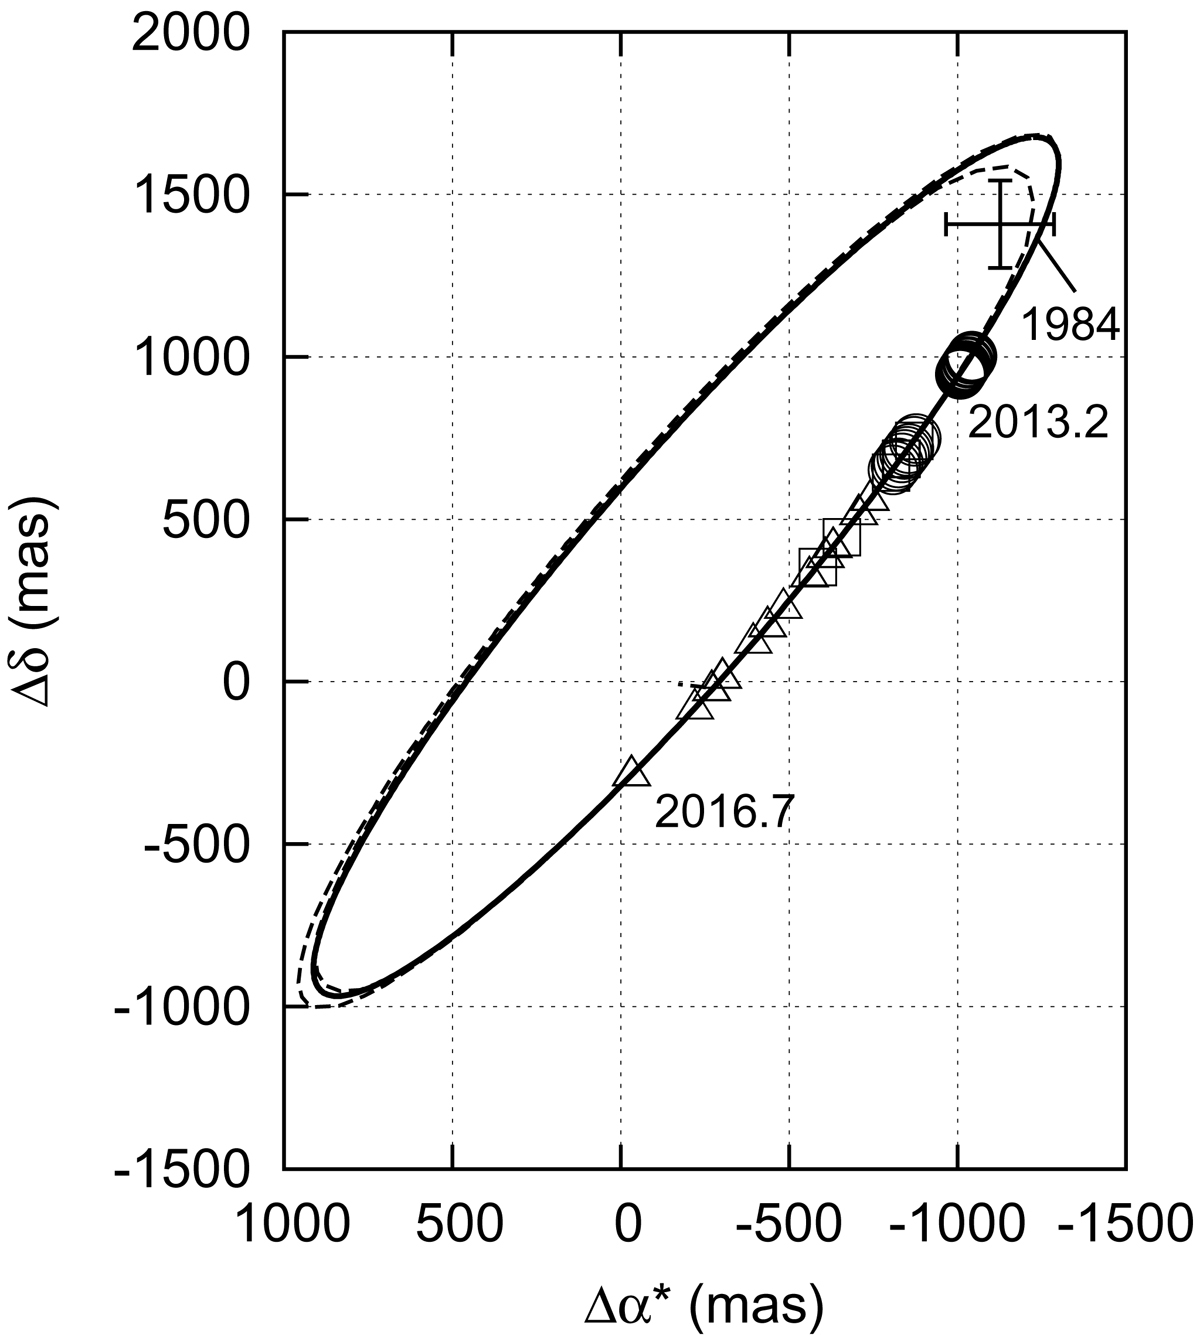
Motion of component B relative to A for the direct data fit (solid line) for all solutions expected within the 68.3% confidence interval (indicated by the space between the dashed lines), and the measured positions with FORS2 (open circles), HST (triangles), GeMS (squares), and ESO-R obtained in 1984 (the cross with error bars).
Current usage metrics show cumulative count of Article Views (full-text article views including HTML views, PDF and ePub downloads, according to the available data) and Abstracts Views on Vision4Press platform.
Data correspond to usage on the plateform after 2015. The current usage metrics is available 48-96 hours after online publication and is updated daily on week days.
Initial download of the metrics may take a while.