Fig. 6
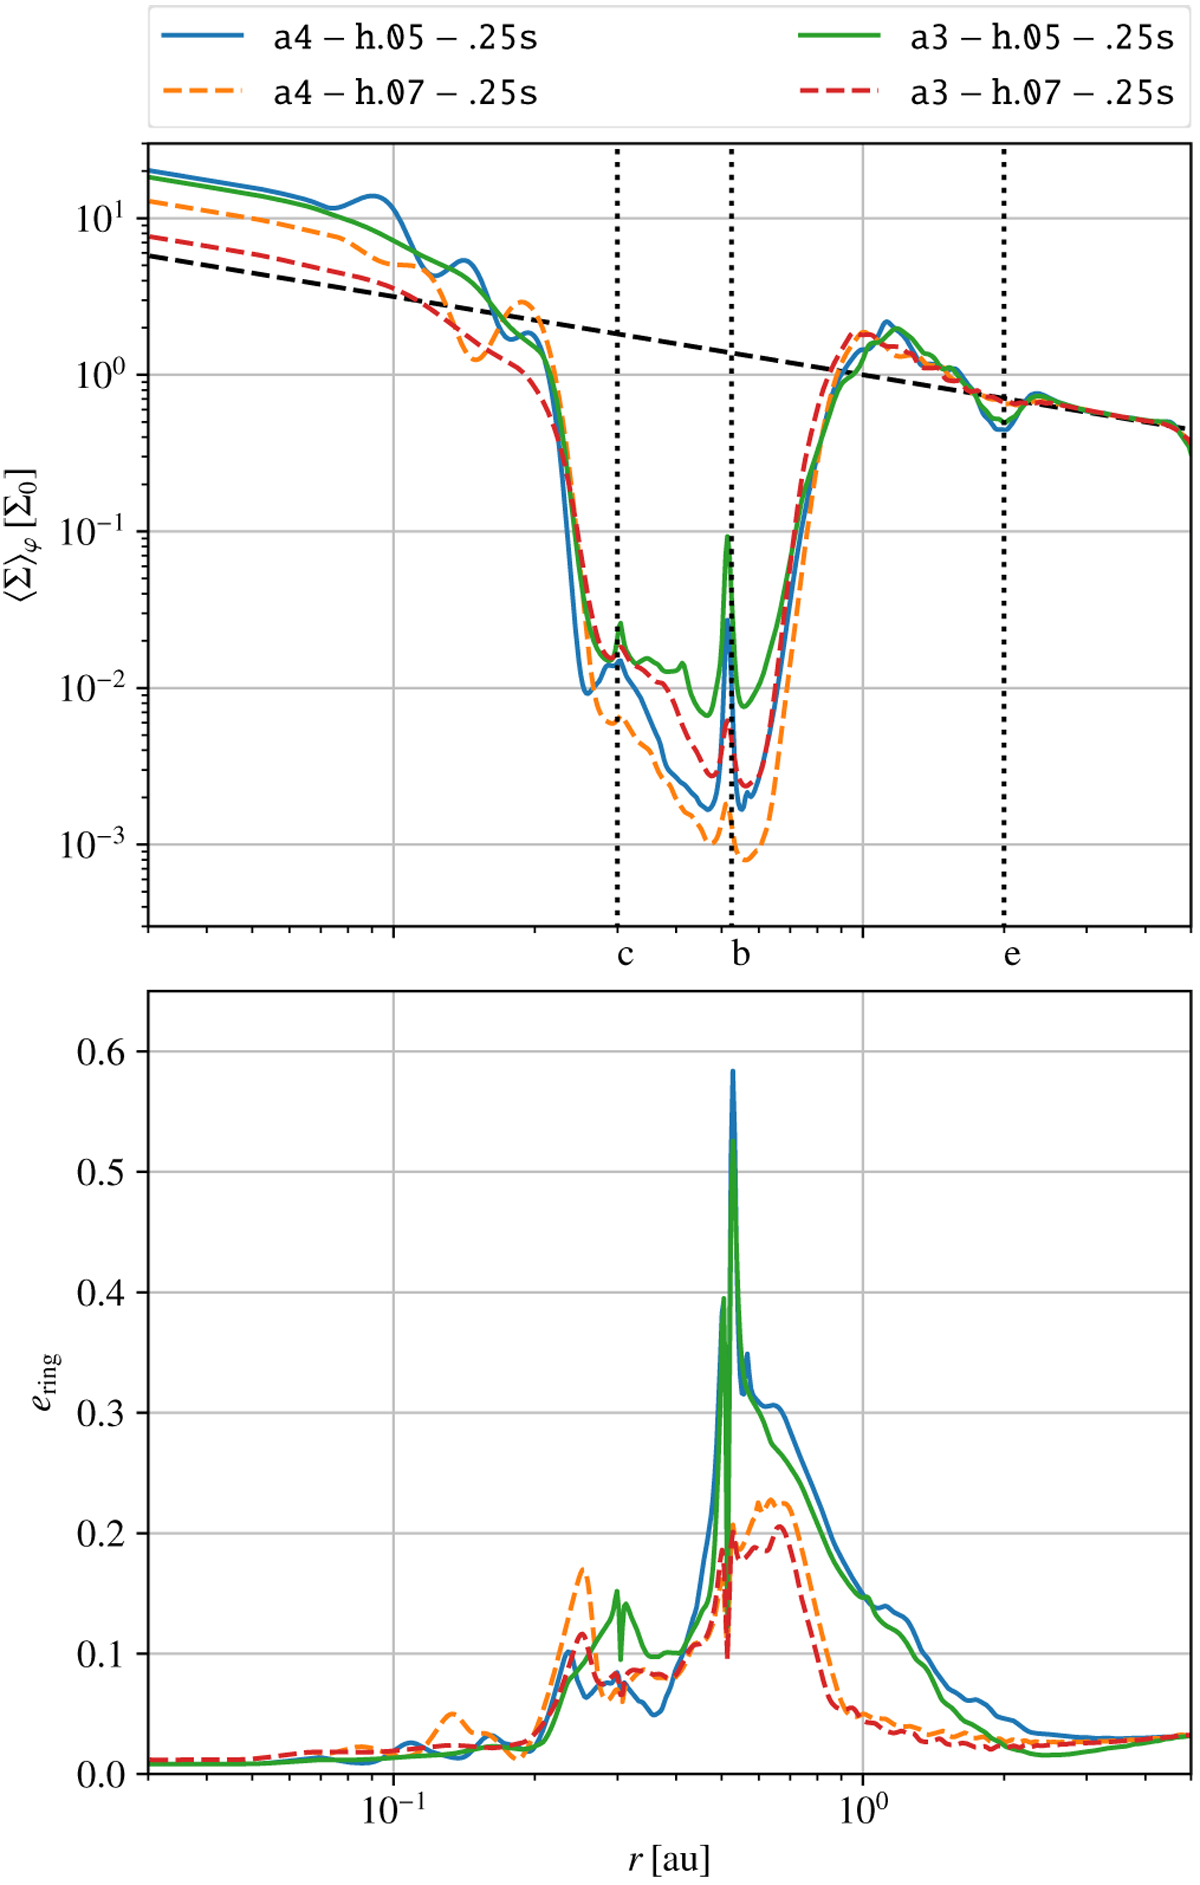
Top panel: azimuthally averaged surface density profile after the relaxation process for four selected models. The dashed black line shows the initial power-law distribution and the three vertical dotted lines mark the positions of the planets. Clearly visible is the joint gap that the giant planets create. While for h = 0.05 (blue, green), a density depression at the Neptune’s location is visible, this is not the case for the thicker disk with h = 0.07 (orange, red). The effect of viscosity in smoothing out density waves in the inner disk is visible as the difference between the blue and green line in the inner disk region. Bottom panel: eccentricity of rings in the same state for these models. We find that a larger scale-height leads to a lower initial eccentricity of the gap edge (blue vs. orange, green vs. red), while higherviscosity leads to slightly lower values (blue vs. green, orange vs. red).
Current usage metrics show cumulative count of Article Views (full-text article views including HTML views, PDF and ePub downloads, according to the available data) and Abstracts Views on Vision4Press platform.
Data correspond to usage on the plateform after 2015. The current usage metrics is available 48-96 hours after online publication and is updated daily on week days.
Initial download of the metrics may take a while.