Fig. 3
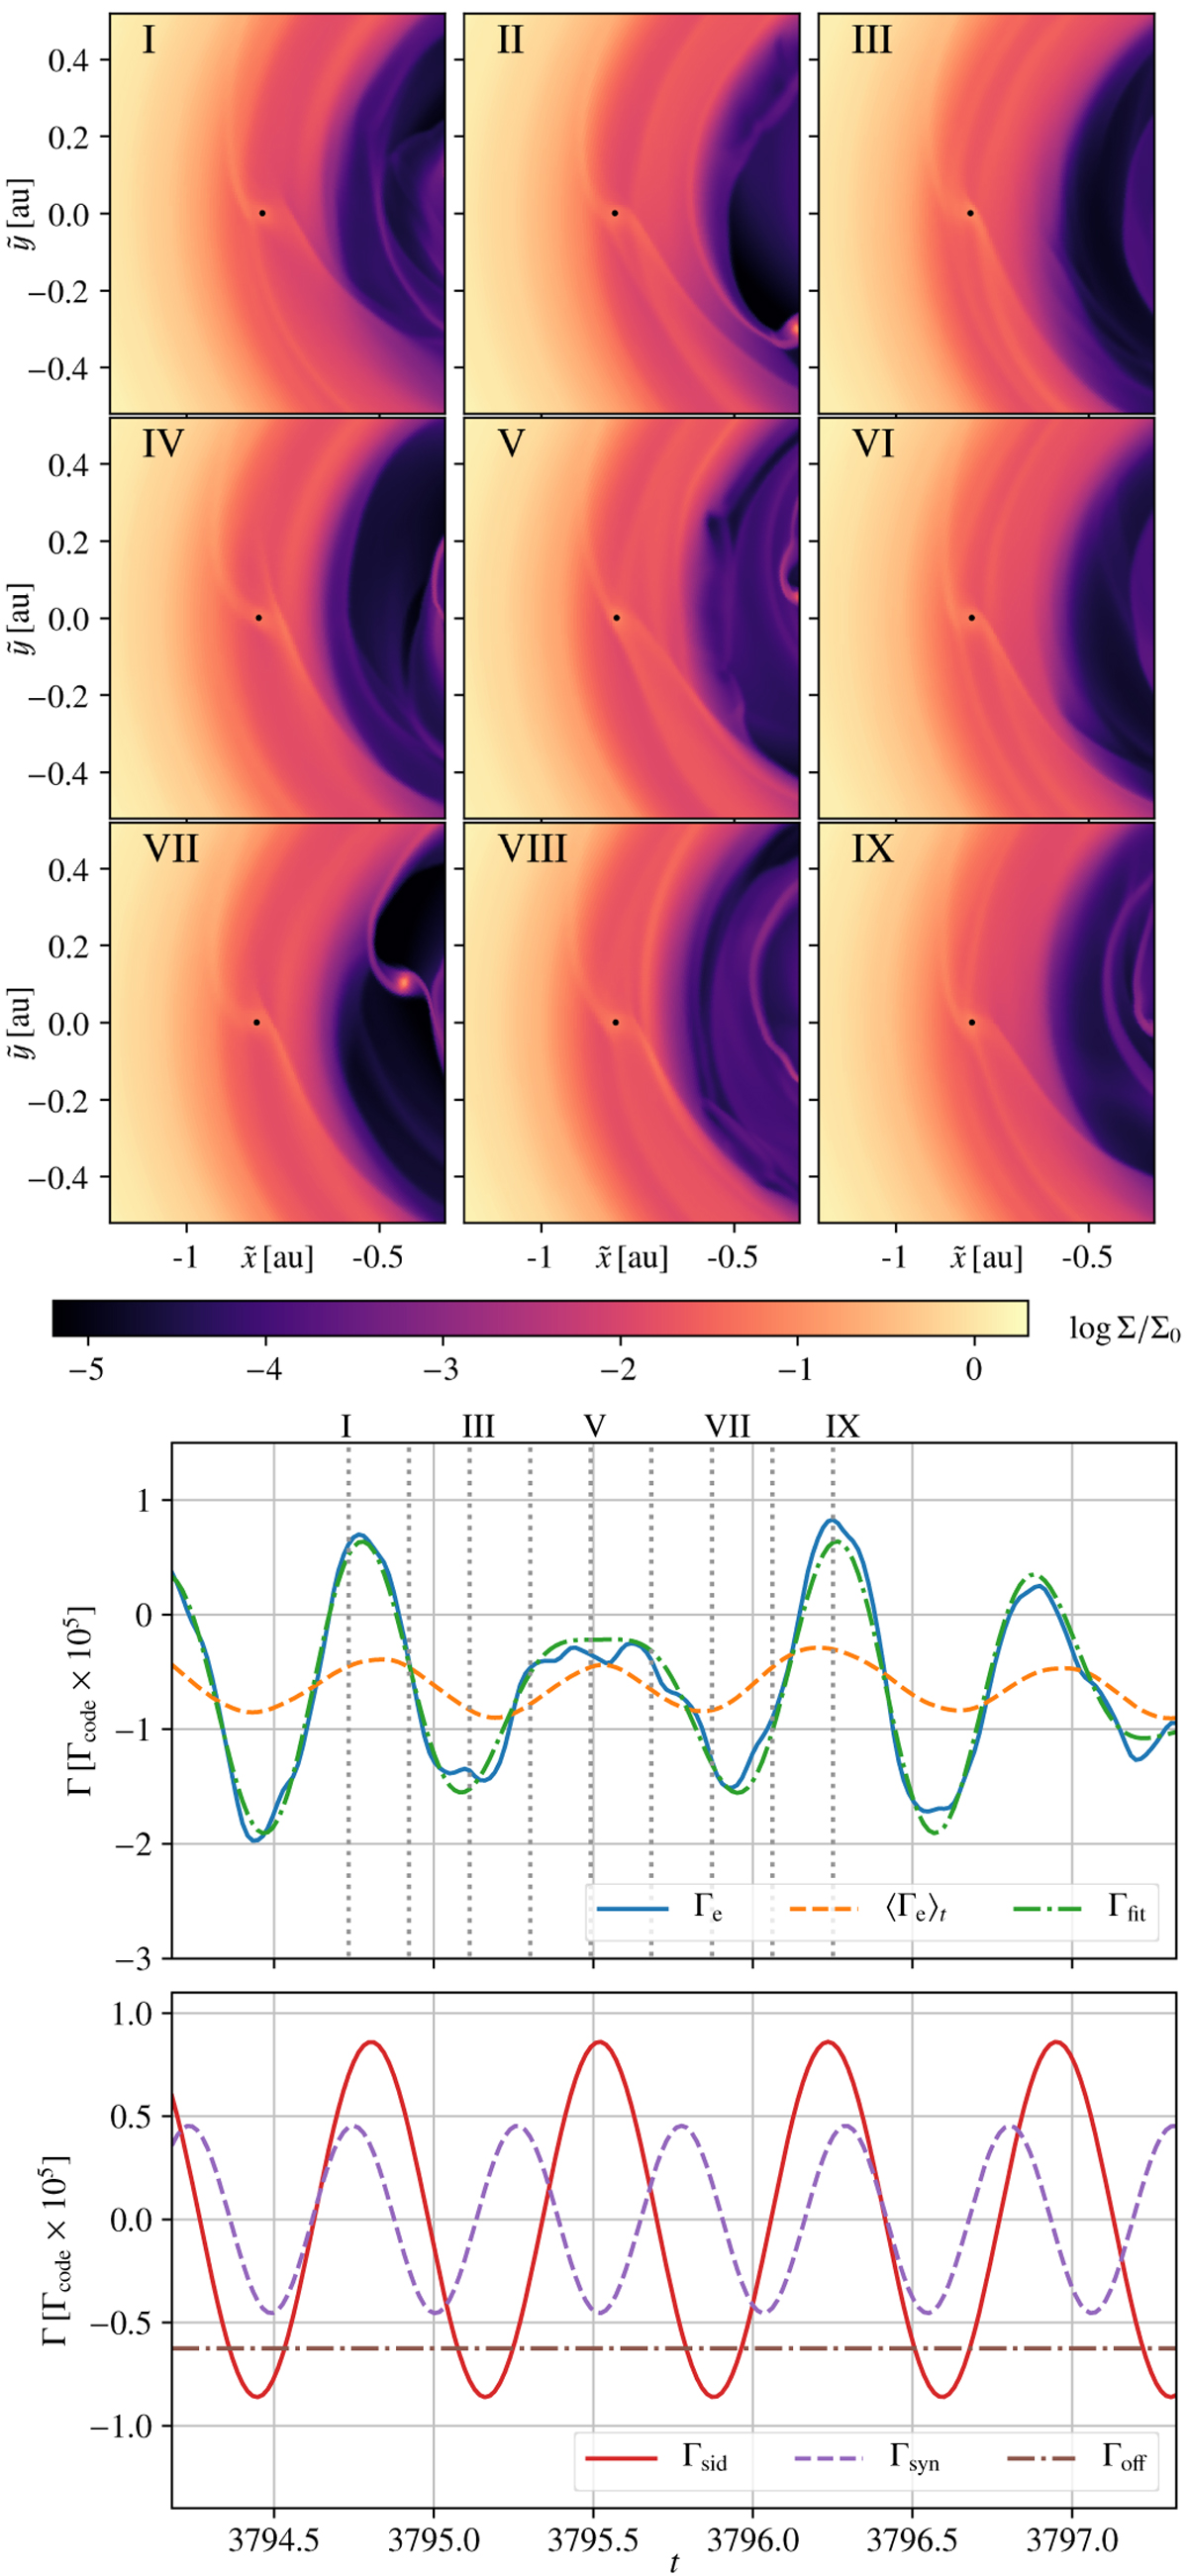
Top panel: close-up view of the surface density around the Neptune, which is marked by the black dot, for the reference model. We use coordinates that are rotated such that planet e is located around
ỹ = 0 with ![]() . This shows the state where the outer planet is migrating inward and located close to the gap edge around
t ≃ 4000. The Neptune’s outer spiral arm remains intact and shows little change, the inner spiral arm interacts with the eccentric gap edge. The spiral arm driven by the giant planet can be seen passing through the planet’s location. Middle panel: the blue line shows the torque acting on planet e and the dashed orange line shows its moving time average. The green dash-dotted line represents a fit according to Eq. (10). Vertical dotted lines refer by labels to the moments in time that we plot in the top panel. Bottom panel: the three components of our fit: the red solid line represents torque variations on the sidereal period of the Neptune, the purple dashed line corresponds to the synodic variations, and the brown dash-dotted line represents a constant offset.
. This shows the state where the outer planet is migrating inward and located close to the gap edge around
t ≃ 4000. The Neptune’s outer spiral arm remains intact and shows little change, the inner spiral arm interacts with the eccentric gap edge. The spiral arm driven by the giant planet can be seen passing through the planet’s location. Middle panel: the blue line shows the torque acting on planet e and the dashed orange line shows its moving time average. The green dash-dotted line represents a fit according to Eq. (10). Vertical dotted lines refer by labels to the moments in time that we plot in the top panel. Bottom panel: the three components of our fit: the red solid line represents torque variations on the sidereal period of the Neptune, the purple dashed line corresponds to the synodic variations, and the brown dash-dotted line represents a constant offset.
Current usage metrics show cumulative count of Article Views (full-text article views including HTML views, PDF and ePub downloads, according to the available data) and Abstracts Views on Vision4Press platform.
Data correspond to usage on the plateform after 2015. The current usage metrics is available 48-96 hours after online publication and is updated daily on week days.
Initial download of the metrics may take a while.