Fig. 6
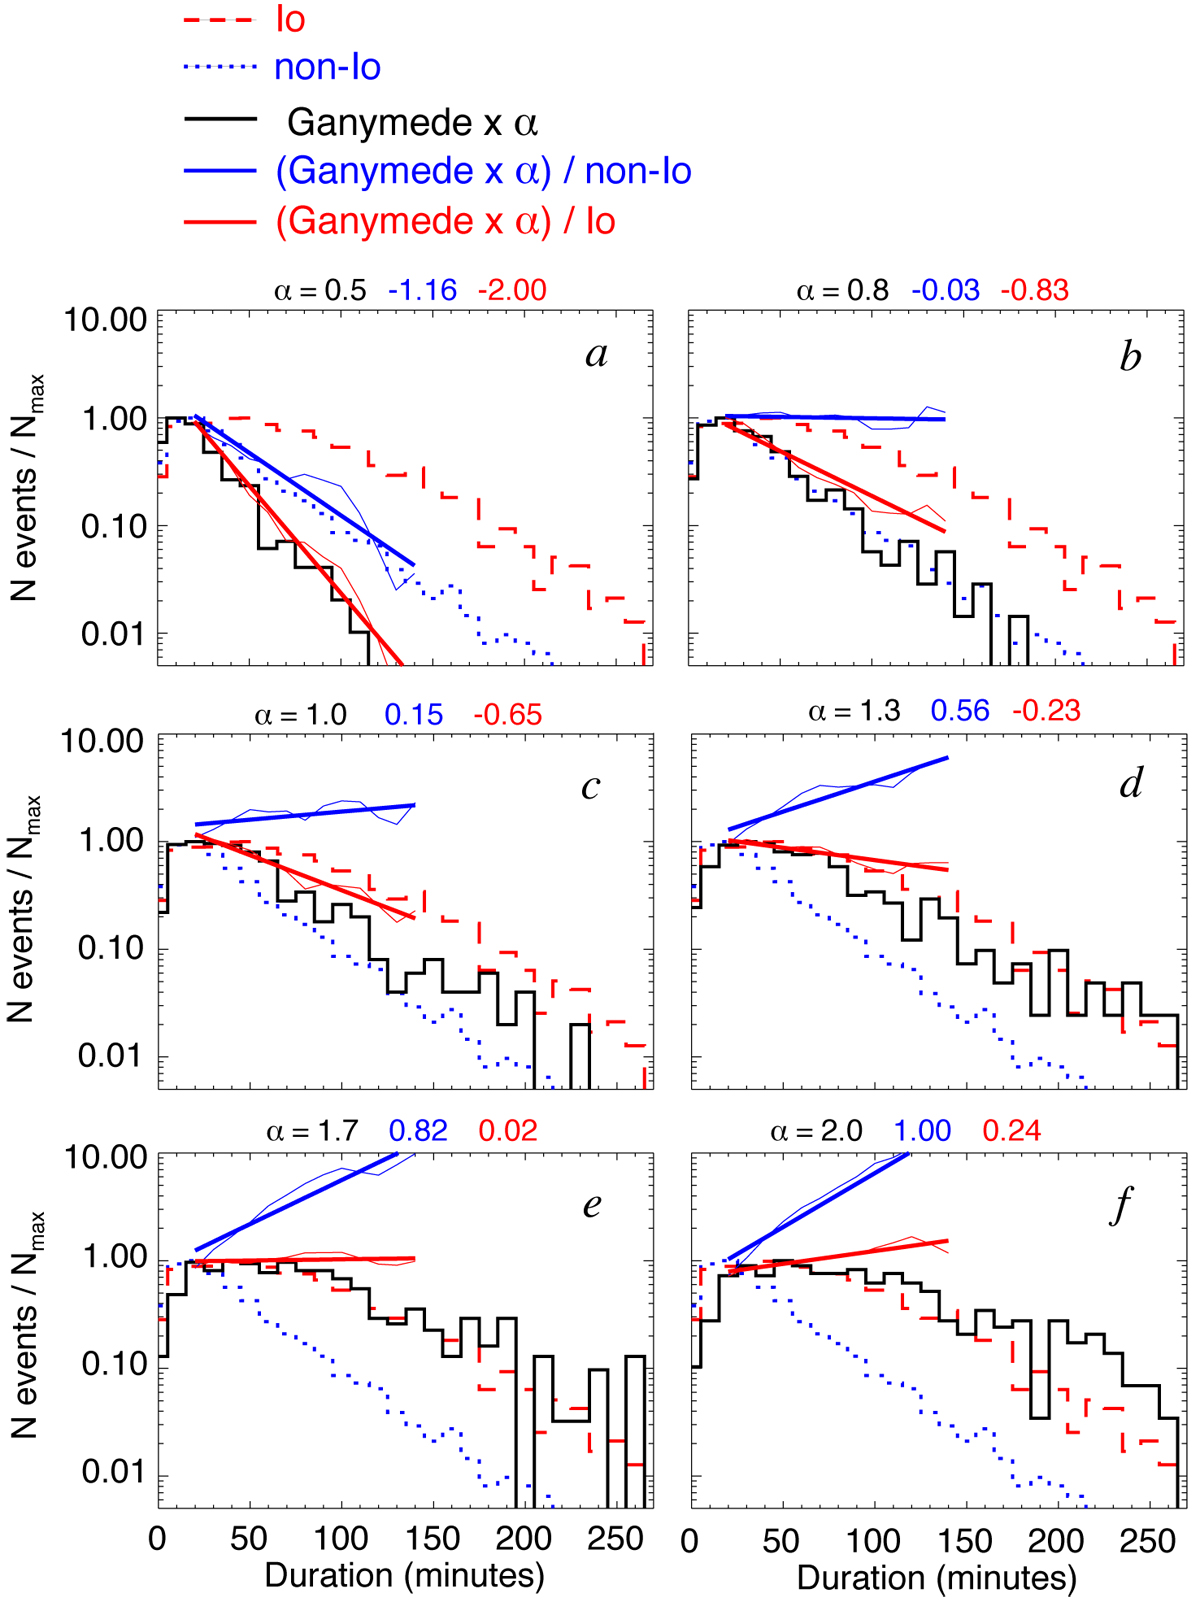
Determination of the ratio between typical durations of Ganymede–Jupiter, Io–Jupiter, and non-Io emissions. Histograms of rescaled Ganymede–Jupiter event durations by a factor α are displayed for six representative values of α – indicated above each panel – among those studied (0.5 ≤ α ≤ 2.0, by steps of 0.1). On all panels, the red dashed (resp. blue dotted) histogram is the normalized distribution of durations of Io–Jupiter (resp. non-Io) emission events, similar to the black dashed and dotted histograms of Fig. 4b. The black solid line is the normalized distribution of rescaled durations of Ganymede–Jupiter events. Thin solid red (resp. blue) lines are the bin-to-bin ratio of the rescaled Ganymede–Jupiter histogram to the Io–Jupiter (resp. non-Io) one, over the range 20–180 min. Boldface straight lines are the degree 1 (lin-log) fit of the thin lines of corresponding colour, whose slopes are indicated at the top of the plots.
Current usage metrics show cumulative count of Article Views (full-text article views including HTML views, PDF and ePub downloads, according to the available data) and Abstracts Views on Vision4Press platform.
Data correspond to usage on the plateform after 2015. The current usage metrics is available 48-96 hours after online publication and is updated daily on week days.
Initial download of the metrics may take a while.