Fig. 1
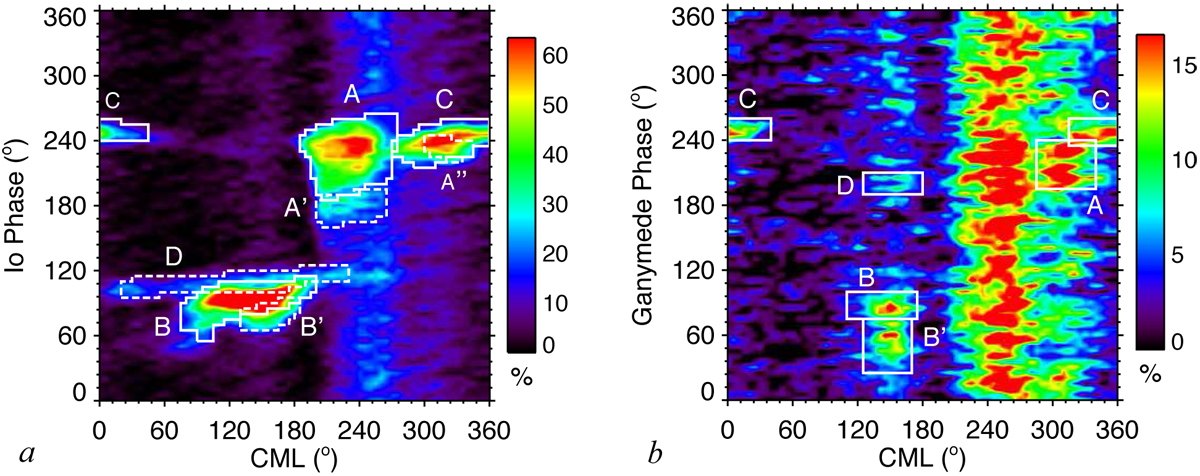
Occurrence probabilities of Jovian radio emissions detected over 26 yr (1990–2015) with the Nançay DecameterArray, displayed as 2D histograms as a function of planetary rotation (CML = Central Meridian Longitude = sub-observer’s longitude) and of the orbital phase of the considered satellite, in 5° × 5° bins (interpolation at 1° resolution was applied to smooth the display). Panel a: occurrence probability of all emissions vs. CML and Io’s orbital phase. The regions of high occurrence within letter-labelled white boxes correspond to Io–Jupiter emissions (usually named Io-A, Io-B …), whereas vertical bands of emission covering restricted CML ranges at all Io phases correspond to non-Io emissions (auroral orinduced by other satellites). Different line styles are used to better distinguish overlapping boxes. Panel b: occurrence probability of non-Io emissions vs. CML and Ganymede’s orbital phase. Ganymede–Jupiter emissions show up within new regions of enhanced occurrence (white boxes), labelled A–D in reference to the non-Io components in which they have been identified (see Fig. 2 for details).
Current usage metrics show cumulative count of Article Views (full-text article views including HTML views, PDF and ePub downloads, according to the available data) and Abstracts Views on Vision4Press platform.
Data correspond to usage on the plateform after 2015. The current usage metrics is available 48-96 hours after online publication and is updated daily on week days.
Initial download of the metrics may take a while.