Fig. 9.
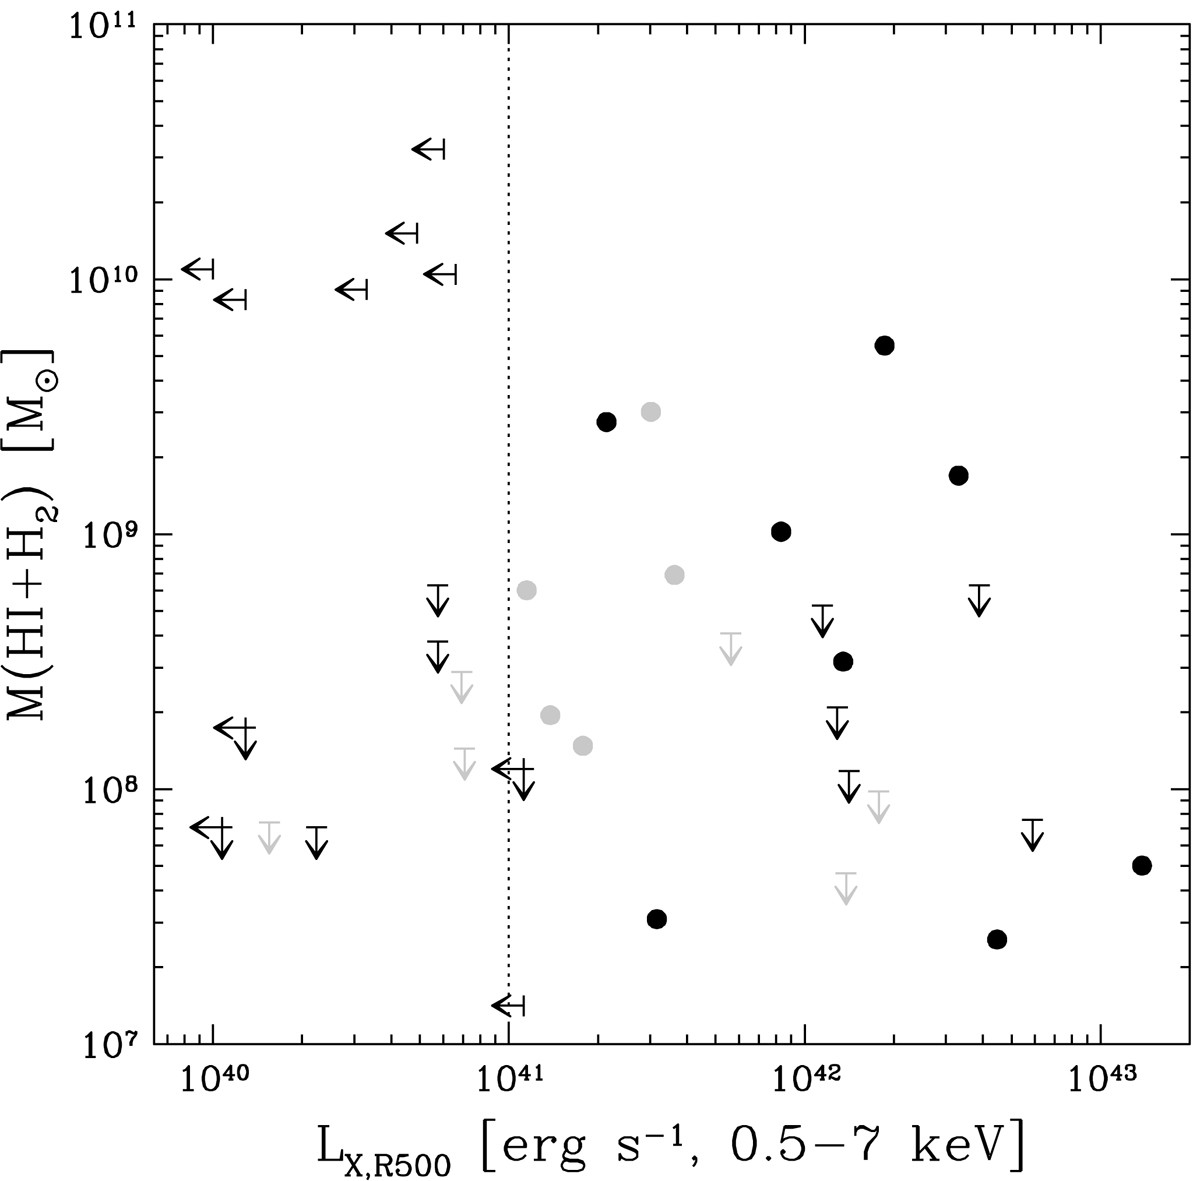
Cold gas mass against 0.5–7 keV X-ray luminosity within R500 for a subset of our groups. Black points indicate systems in the CLoGS high-richness sample (O’Sullivan et al. 2017), for which complete X-ray data are available. Grey points mark additional groups for which X-ray luminosities were drawn from the literature. The dotted line indicates the 1041 ergs−1 dividing line between X-ray bright and faint systems.
Current usage metrics show cumulative count of Article Views (full-text article views including HTML views, PDF and ePub downloads, according to the available data) and Abstracts Views on Vision4Press platform.
Data correspond to usage on the plateform after 2015. The current usage metrics is available 48-96 hours after online publication and is updated daily on week days.
Initial download of the metrics may take a while.