Free Access
Fig. 1.
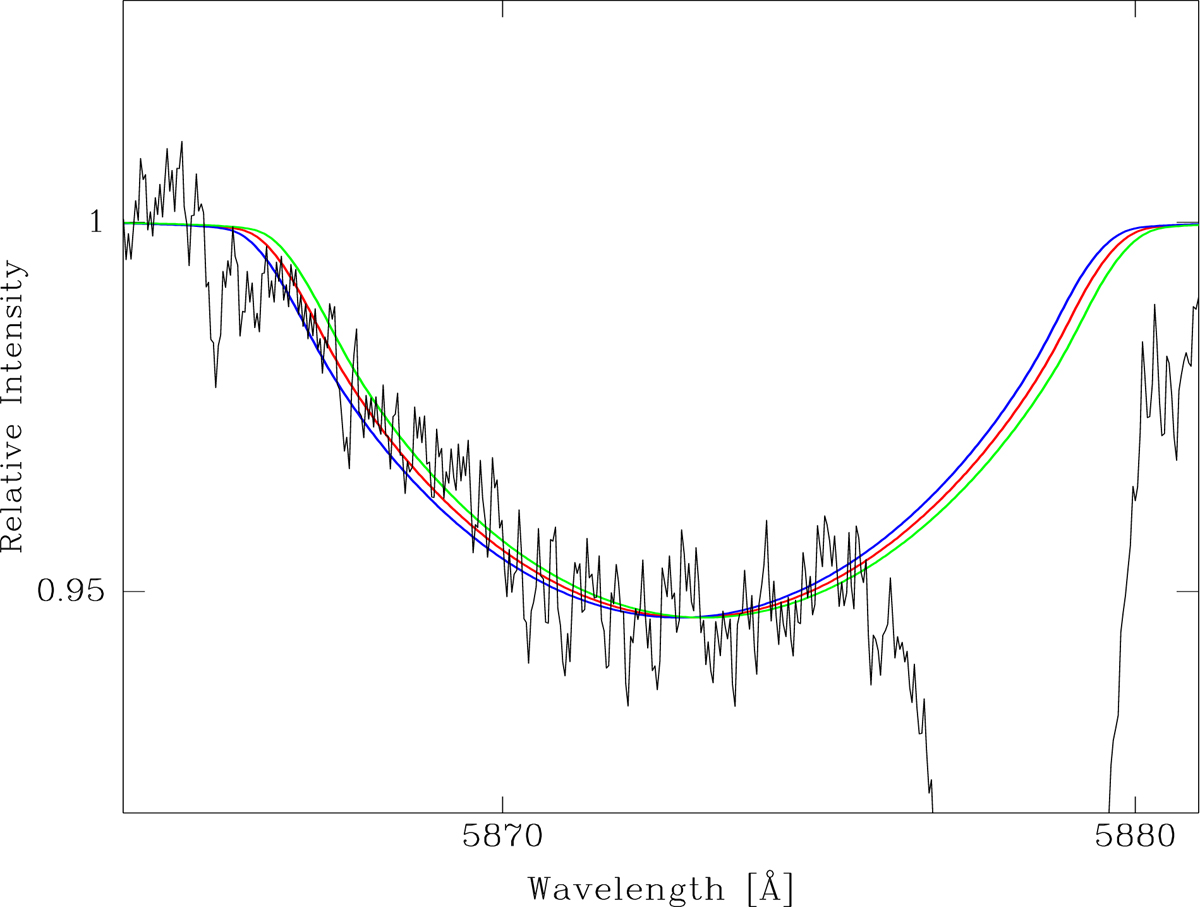
Comparison of observed composite spectrum (in black) with three synthetic templates shifted with different RVs around He Iλ5875. The blue line is shifted by 130 km s−1, red by 140, and green by 150 km s−1. The green curve best fits the spectrum, but the others are not so bad.
Current usage metrics show cumulative count of Article Views (full-text article views including HTML views, PDF and ePub downloads, according to the available data) and Abstracts Views on Vision4Press platform.
Data correspond to usage on the plateform after 2015. The current usage metrics is available 48-96 hours after online publication and is updated daily on week days.
Initial download of the metrics may take a while.