Fig. 3.
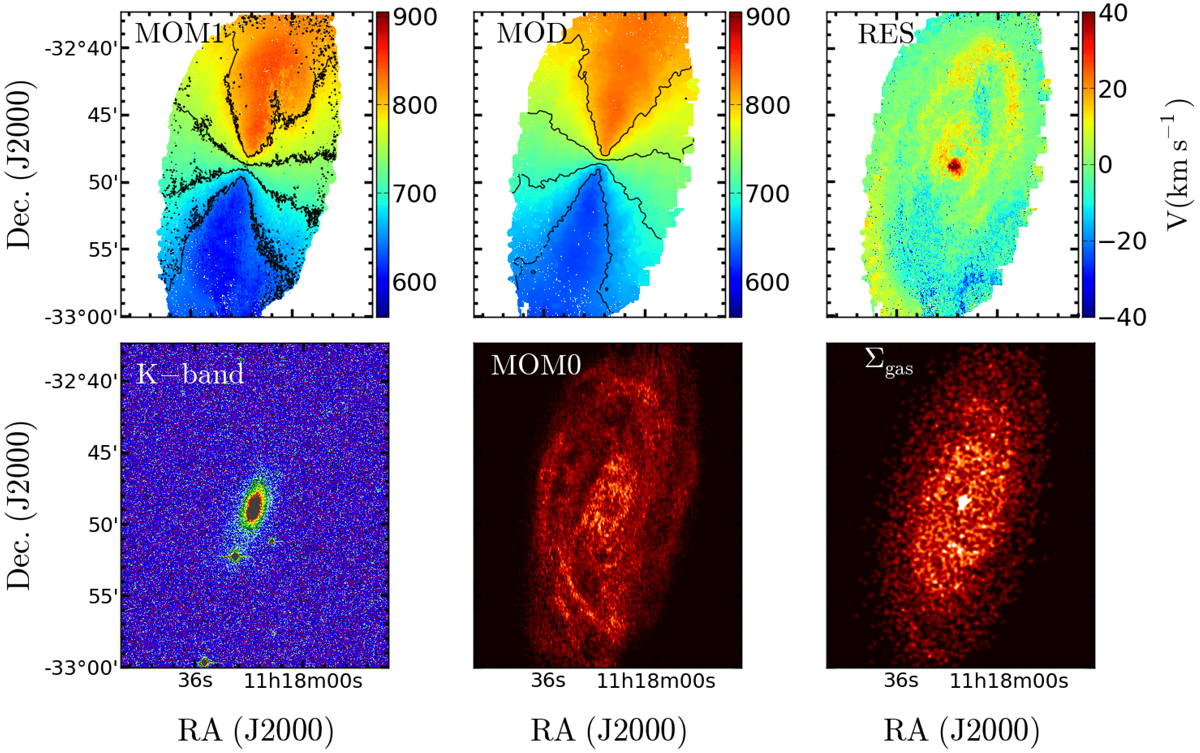
Observed and simulated maps for NGC 3621, Model-A at T = 2 Gyr: the moment-1, model velocity field and residual maps are presented on the top panels. The black contours are spaced by 50 km s−1. The near-infrared K-band image from Jarrett et al. (2003; it is important to note that this is not used in any analysis, but to show the corresponding stellar systems to the gas maps that are used for the analysis) is shown with the moment-0 and the simulated gas surface density maps on the bottom panels. The moment1 and moment0 maps are obtained from the THINGS database (http://www.mpia.de/THINGS/Data.html).
Current usage metrics show cumulative count of Article Views (full-text article views including HTML views, PDF and ePub downloads, according to the available data) and Abstracts Views on Vision4Press platform.
Data correspond to usage on the plateform after 2015. The current usage metrics is available 48-96 hours after online publication and is updated daily on week days.
Initial download of the metrics may take a while.