Fig. 2.
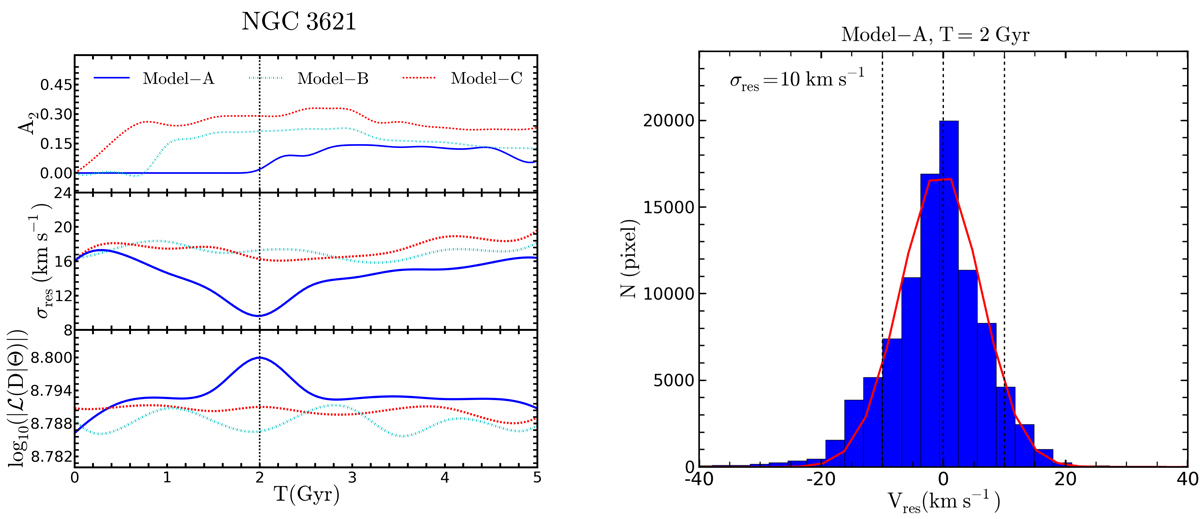
Left panels: variation of the bar strength A2 as function of the epoch is shown on the top panel, the standard deviation of the residual σres on the middle and the variation of the likelihood. The vertical dashed line indicates the epoch of the selected snapshot. Right panel: histogram of the residuals for Model-A at T = 2.0 Gyr, the red line is the best fit to the data and σres is the standard deviation of the residuals. The vertical dashed lines indicate the mean and standard deviation of the residuals.
Current usage metrics show cumulative count of Article Views (full-text article views including HTML views, PDF and ePub downloads, according to the available data) and Abstracts Views on Vision4Press platform.
Data correspond to usage on the plateform after 2015. The current usage metrics is available 48-96 hours after online publication and is updated daily on week days.
Initial download of the metrics may take a while.