Fig. 12.
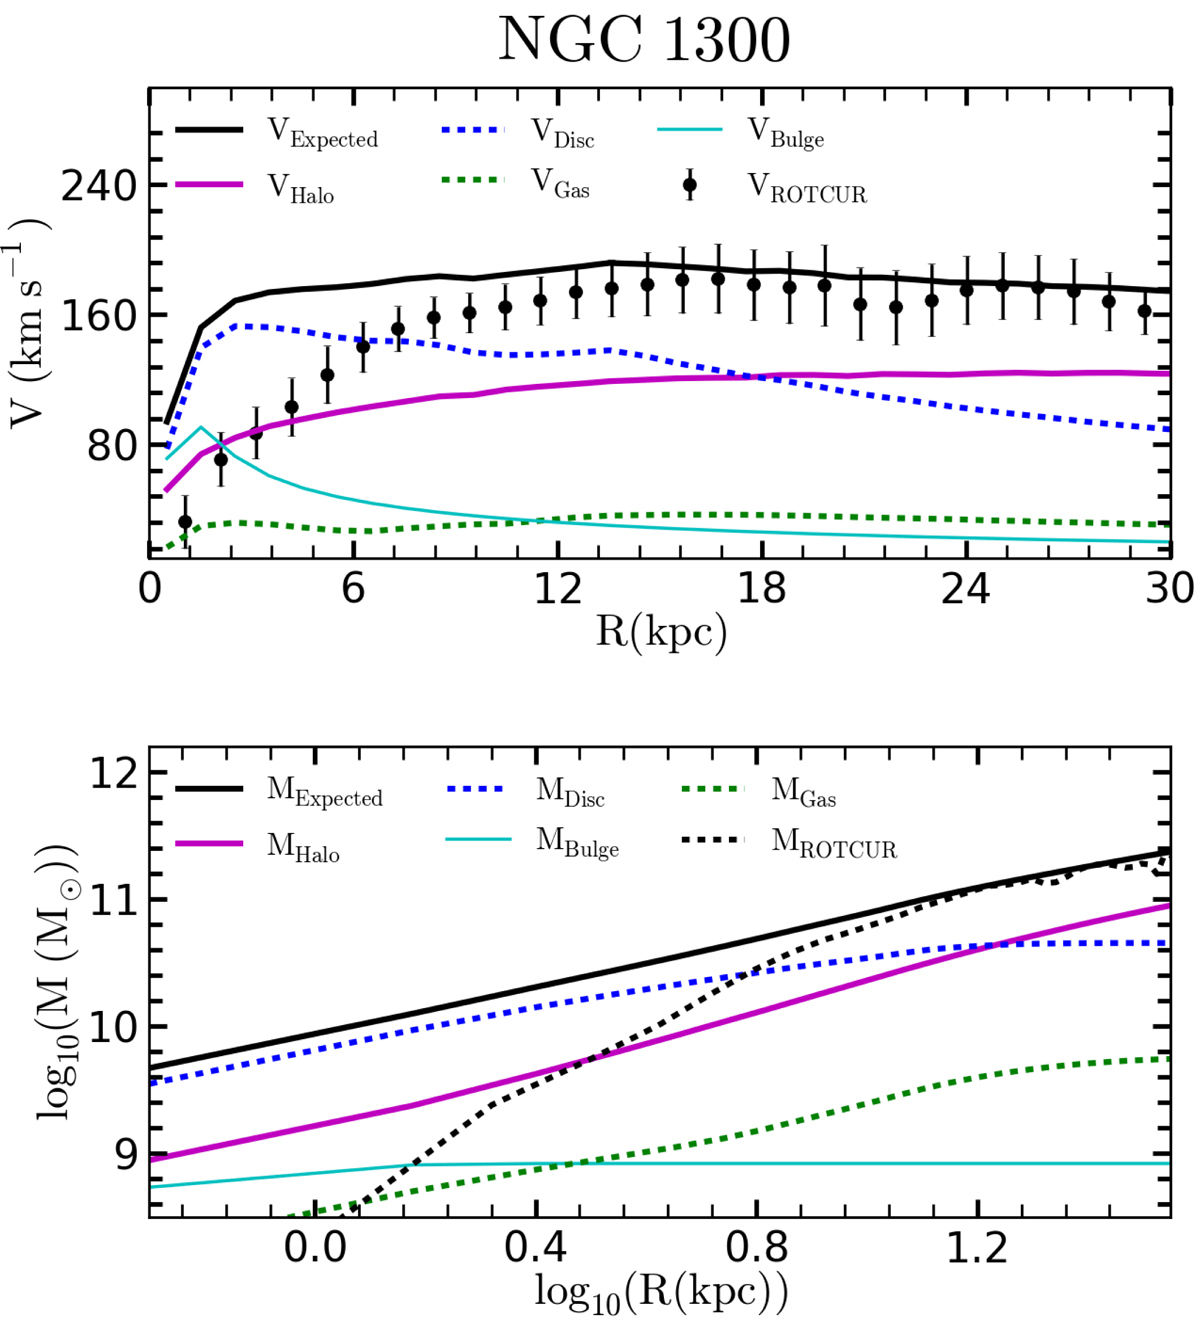
RC measured with ROTCUR is compared with the expected velocities from the gravitational force. The mass profile inferred from the ROTCUR RC and the expected mass from the snapshot are presented on the bottom panel where the black points are the ROTCUR RC, the expected velocities and mass are shown as black lines, the stellar disk is shown as dashed blue, the green dashed line is the gas disk contribution, the magenta line is the halo contribution, the cyan line the bulge component and the dashed black line on the bottom panel is the mass profile inferred from the ROTCUR RC.
Current usage metrics show cumulative count of Article Views (full-text article views including HTML views, PDF and ePub downloads, according to the available data) and Abstracts Views on Vision4Press platform.
Data correspond to usage on the plateform after 2015. The current usage metrics is available 48-96 hours after online publication and is updated daily on week days.
Initial download of the metrics may take a while.