Fig. 1.
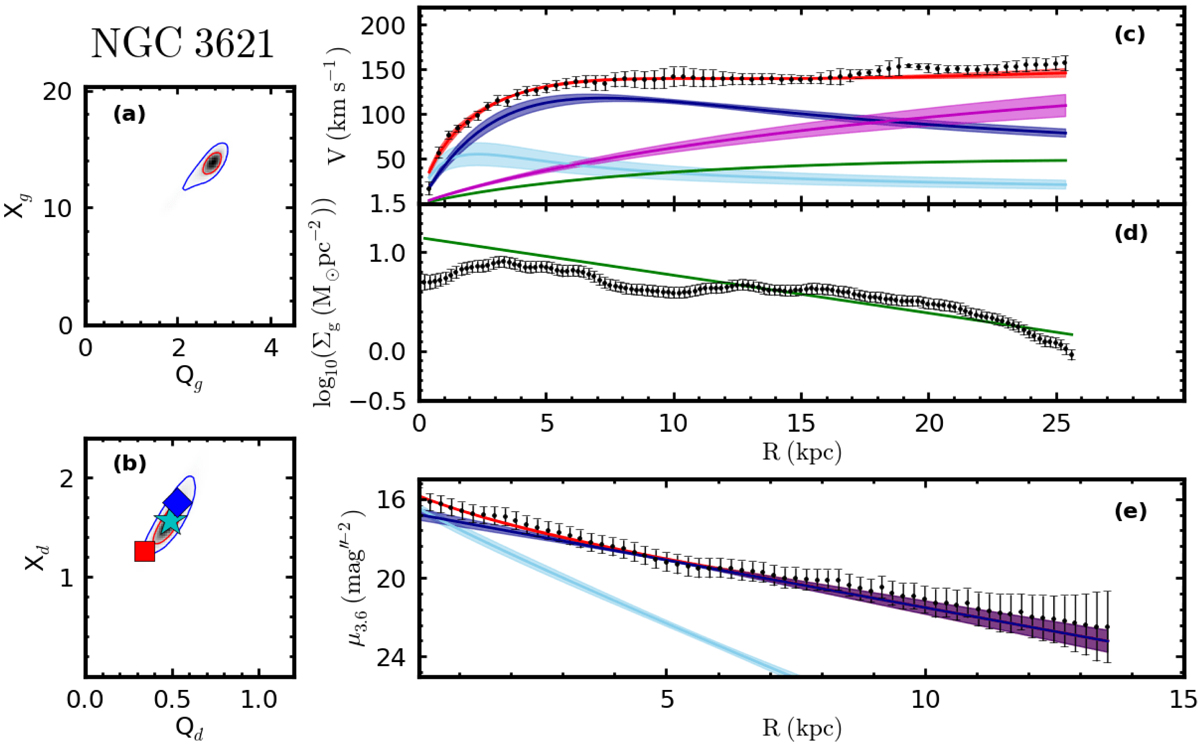
Left panels: PDFs of the disk stability parameters, Q and X. Panel a is for the gas disk, while panel b is for the stellar disk. The stability parameters for the selected models are plotted on I where Model-A is shown as blue diamond, Model-B as cyan star and Model-C as red square. Right panels: PDFs of the RCs (panel c), gas surface density (panel d) and 3.6 μ surface brightness profile (panel e). The best fit to the data is shown as red lines, the stellar disk is shown as dark blue, the green lines are the gas disk contribution, the magenta line is the halo contribution and the light blue lines are the bulge component. The shaded area shows the 1-σ error and the data are shown as black points.
Current usage metrics show cumulative count of Article Views (full-text article views including HTML views, PDF and ePub downloads, according to the available data) and Abstracts Views on Vision4Press platform.
Data correspond to usage on the plateform after 2015. The current usage metrics is available 48-96 hours after online publication and is updated daily on week days.
Initial download of the metrics may take a while.