Fig. 7
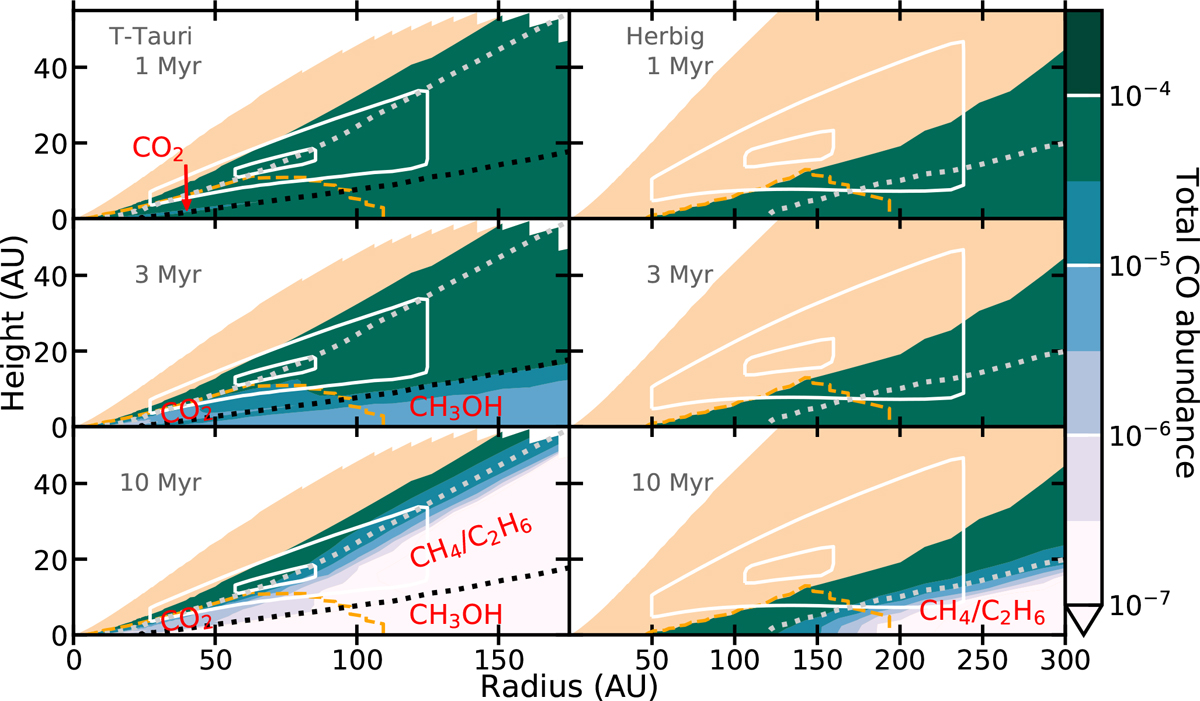
Total CO abundance (gas and ice) from the chemical models, at 1, 3 and 10 Myr, mapped onto the temperature and density structure of a T Tauri and Herbig disk model (see Fig. A.1 and Appendix A). A cosmic-ray ionisation rate of 10−17 s−1 is assumedthroughout the disk. The orange area shows the disk region that has a temperature above 40 K and is thus not included in our chemical models. See Fig. A.1 for the CO abundance in that region using a simple CO chemistry. The white contours shows the area within which 25% and 75% of the C18O flux is emitted. The black and grey dotted lines show the 20 and 30 K contours, respectively. The Herbig disk is always warmer than 20 K. The molecules in red denote the dominant carbon carrier in the regions CO is depleted. The orange dashed line encompasses the region that is completely shielded from UV radiation (see Sect. 2.1).
Current usage metrics show cumulative count of Article Views (full-text article views including HTML views, PDF and ePub downloads, according to the available data) and Abstracts Views on Vision4Press platform.
Data correspond to usage on the plateform after 2015. The current usage metrics is available 48-96 hours after online publication and is updated daily on week days.
Initial download of the metrics may take a while.