Fig. 6
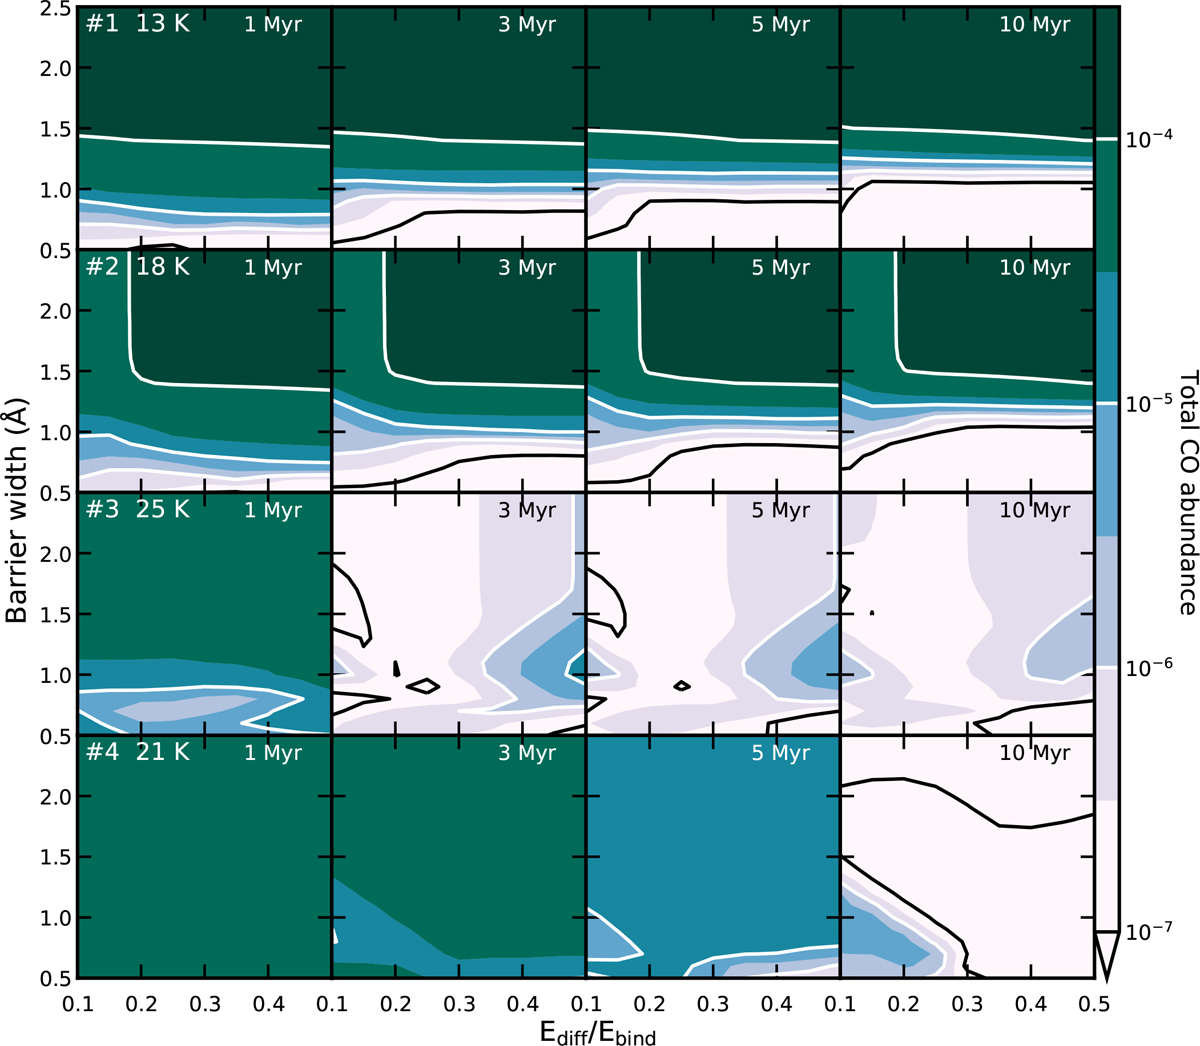
Time evolution of total CO abundance (ice and gas) as function of the assumed tunnelling barrier width (atunnel) and diffusion-to-binding energy ratio (fdiff). All these models have ![]() s−1. The first rowof models uses Tgas = 13 K, ngas = 108 cm−3. The second row of models uses Tgas = 18 K and ngas = 3 × 1011 cm−3. The third row of models uses Tgas = 25 K and ngas = 5 × 1011 cm−3. The fourth row of models uses Tgas = 21 K and ngas = 3 × 106 cm−3. Significant reduction of the total CO abundance in less than 3 Myr is only possible if sCO + sH is efficient, which is at low barrier widths or if sOH preferably reacts with sCO, which is enhanced at low values of fdiff. The fiducial values are atunnel = 1 Å and fdiff = 0.3).
s−1. The first rowof models uses Tgas = 13 K, ngas = 108 cm−3. The second row of models uses Tgas = 18 K and ngas = 3 × 1011 cm−3. The third row of models uses Tgas = 25 K and ngas = 5 × 1011 cm−3. The fourth row of models uses Tgas = 21 K and ngas = 3 × 106 cm−3. Significant reduction of the total CO abundance in less than 3 Myr is only possible if sCO + sH is efficient, which is at low barrier widths or if sOH preferably reacts with sCO, which is enhanced at low values of fdiff. The fiducial values are atunnel = 1 Å and fdiff = 0.3).
Current usage metrics show cumulative count of Article Views (full-text article views including HTML views, PDF and ePub downloads, according to the available data) and Abstracts Views on Vision4Press platform.
Data correspond to usage on the plateform after 2015. The current usage metrics is available 48-96 hours after online publication and is updated daily on week days.
Initial download of the metrics may take a while.