Fig. 1
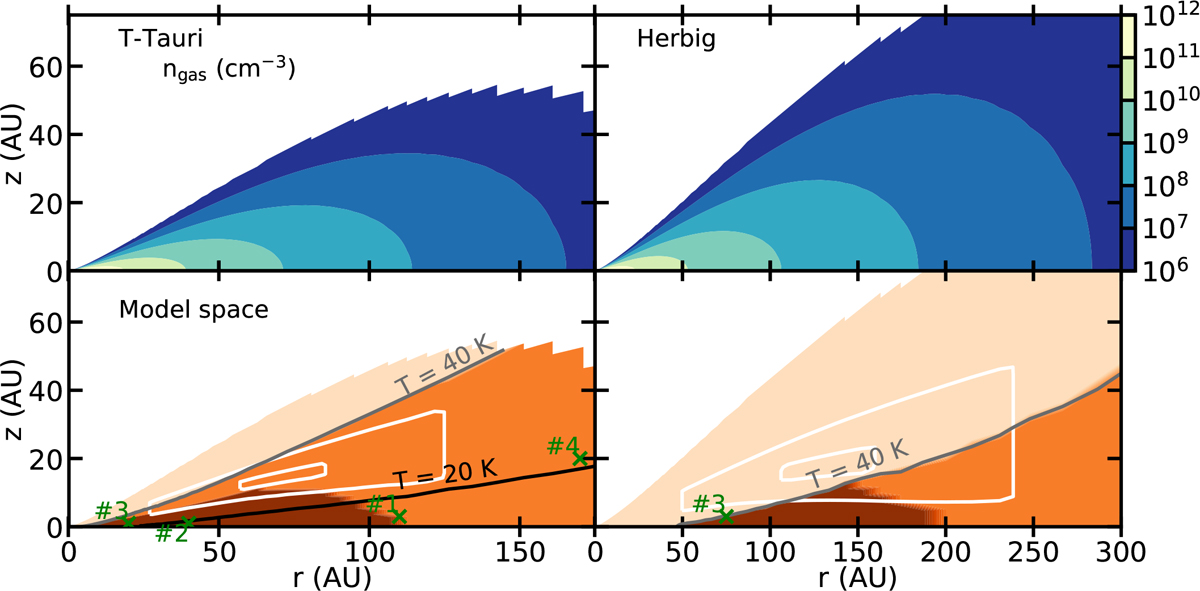
Number density (top panels) and region of the disk included in the parameter study (bottom panels) for a typical T Tauri (L= 0.3 L⊙; left panels) and Herbig (L = 20 L⊙; right panels) disk model (see Appendix A for details). The part of the disk that is included in the physical models is shown in dark orange and is bound by the highest temperature included (40 K) and the restriction that the UV is fully shielded. Light orange denotes the region with temperatures and densities probed by our models but with some low level of UV. White contours show the regions contributing to 25% and 75% of the emission from the C18O 3–2 line. The green crosses numbered #1, #2, #3 and #4 are approximate locations of the representative models of Sect. 3.1.3.
Current usage metrics show cumulative count of Article Views (full-text article views including HTML views, PDF and ePub downloads, according to the available data) and Abstracts Views on Vision4Press platform.
Data correspond to usage on the plateform after 2015. The current usage metrics is available 48-96 hours after online publication and is updated daily on week days.
Initial download of the metrics may take a while.