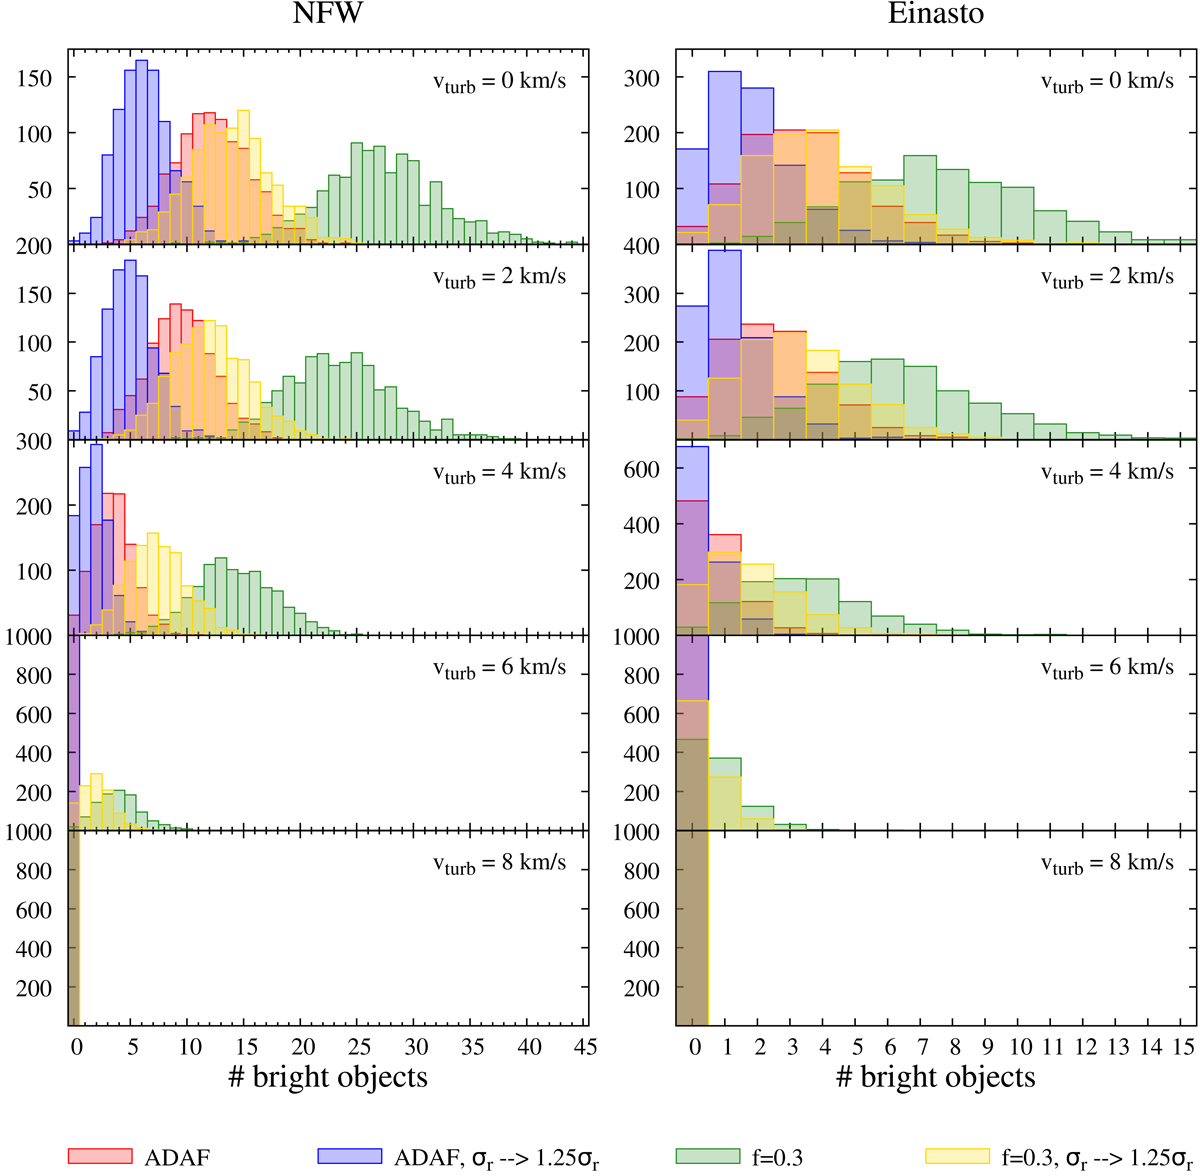
Fig. 4.

Distributions for the number of bright PBHs above the NuSTAR point source detection limit for different levels of turbulence in the CMZ (0–5 km s−1) and for different DM profiles (NFW, Einasto). Each distribution is derived from 1000 independent Monte Carlo realizations. The orange histograms represent the model with only a bulge and DM halo. The green histograms correspond to the case in which the MB 1D velocity dispersion has been increased by 25% to correct for the missing Galactic disk contribution (see Fig. 3). The uniform gas distribution within resolution element is assumed.
Current usage metrics show cumulative count of Article Views (full-text article views including HTML views, PDF and ePub downloads, according to the available data) and Abstracts Views on Vision4Press platform.
Data correspond to usage on the plateform after 2015. The current usage metrics is available 48-96 hours after online publication and is updated daily on week days.
Initial download of the metrics may take a while.


