Free Access
Fig. 2.
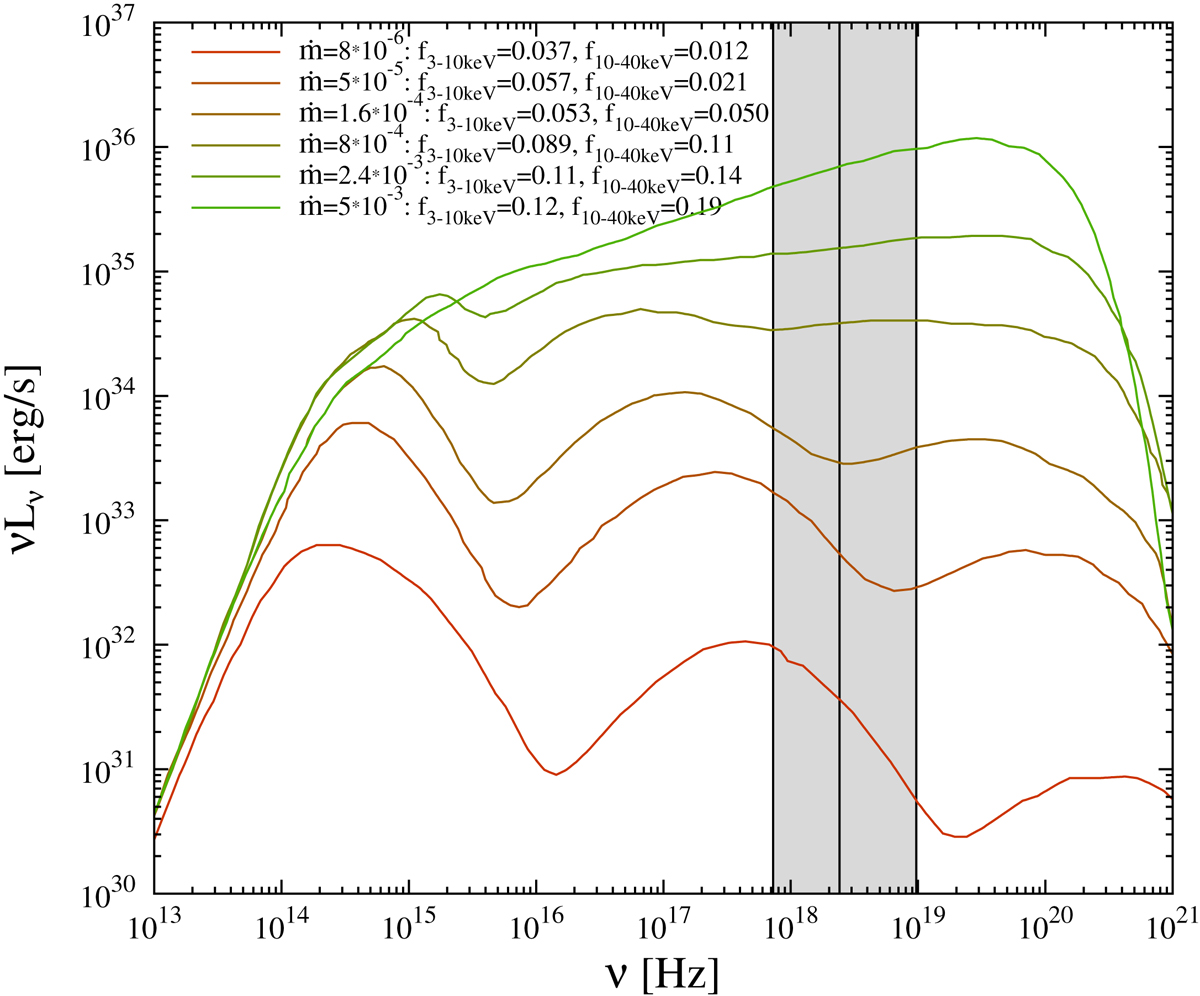
Spectra from ADAF model for various values of the specific accretion rate ṁ ≡ Ṁ/ṀEdd (Yuan & Narayan 2014). The parameters f denote the fractions of energy going to the soft and hard NuSTAR bands shown with the gray-shaded regions.
Current usage metrics show cumulative count of Article Views (full-text article views including HTML views, PDF and ePub downloads, according to the available data) and Abstracts Views on Vision4Press platform.
Data correspond to usage on the plateform after 2015. The current usage metrics is available 48-96 hours after online publication and is updated daily on week days.
Initial download of the metrics may take a while.