Fig. 6
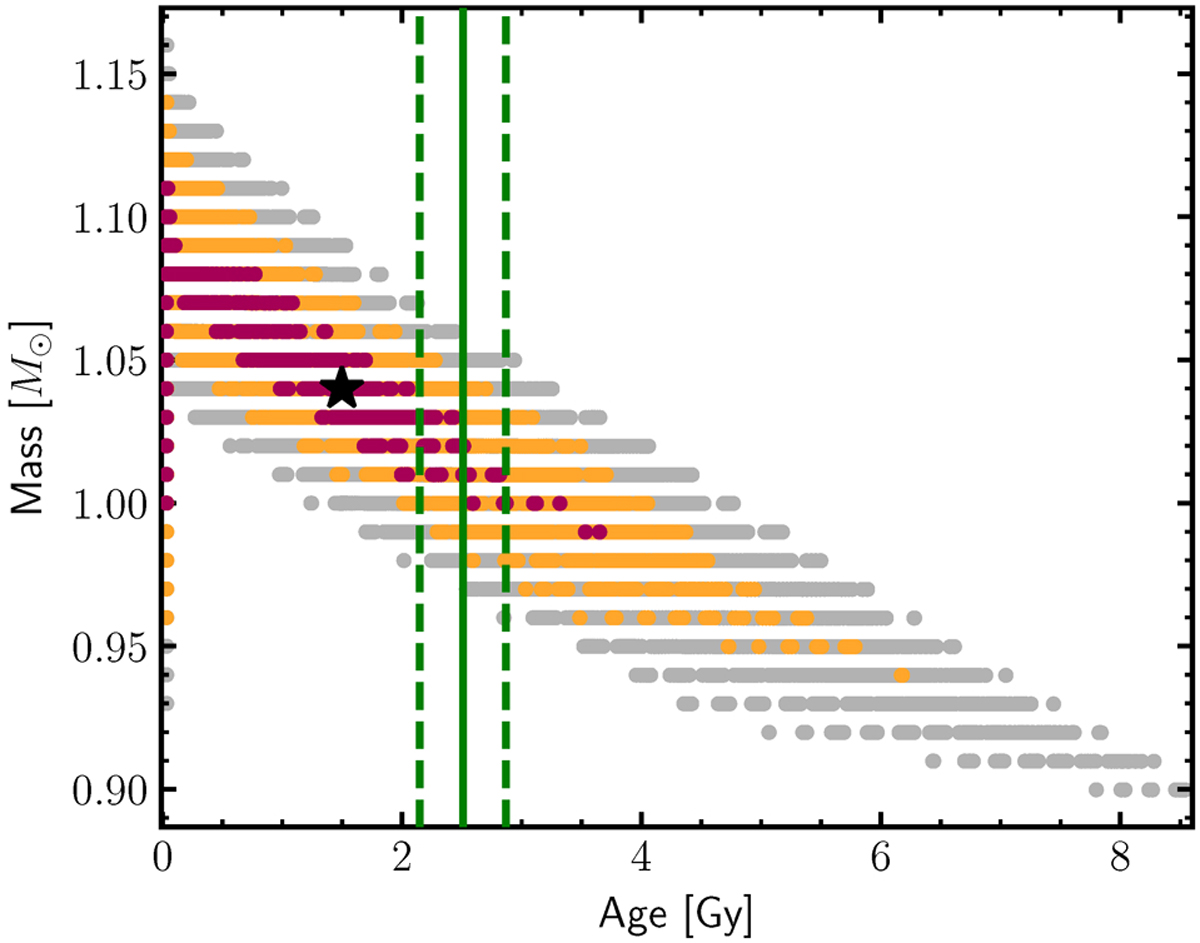
Mass-age diagram of Kepler-9 from MESA stellar evolution models (MIST). The black star and the red, orange, and grey dots correspond to the best-matching value and the 1, 2, and 3σ areas, respectively, derived from results on the density of the data set III photodynamical modelling and fromnew literature values of the effective temperature, the surface gravity, and the metallicity by Petigura et al. (2017). The gyrochronological age is indicated by the green solid line and its 1-σ range with the green dashed lines.
Current usage metrics show cumulative count of Article Views (full-text article views including HTML views, PDF and ePub downloads, according to the available data) and Abstracts Views on Vision4Press platform.
Data correspond to usage on the plateform after 2015. The current usage metrics is available 48-96 hours after online publication and is updated daily on week days.
Initial download of the metrics may take a while.