Fig. 5
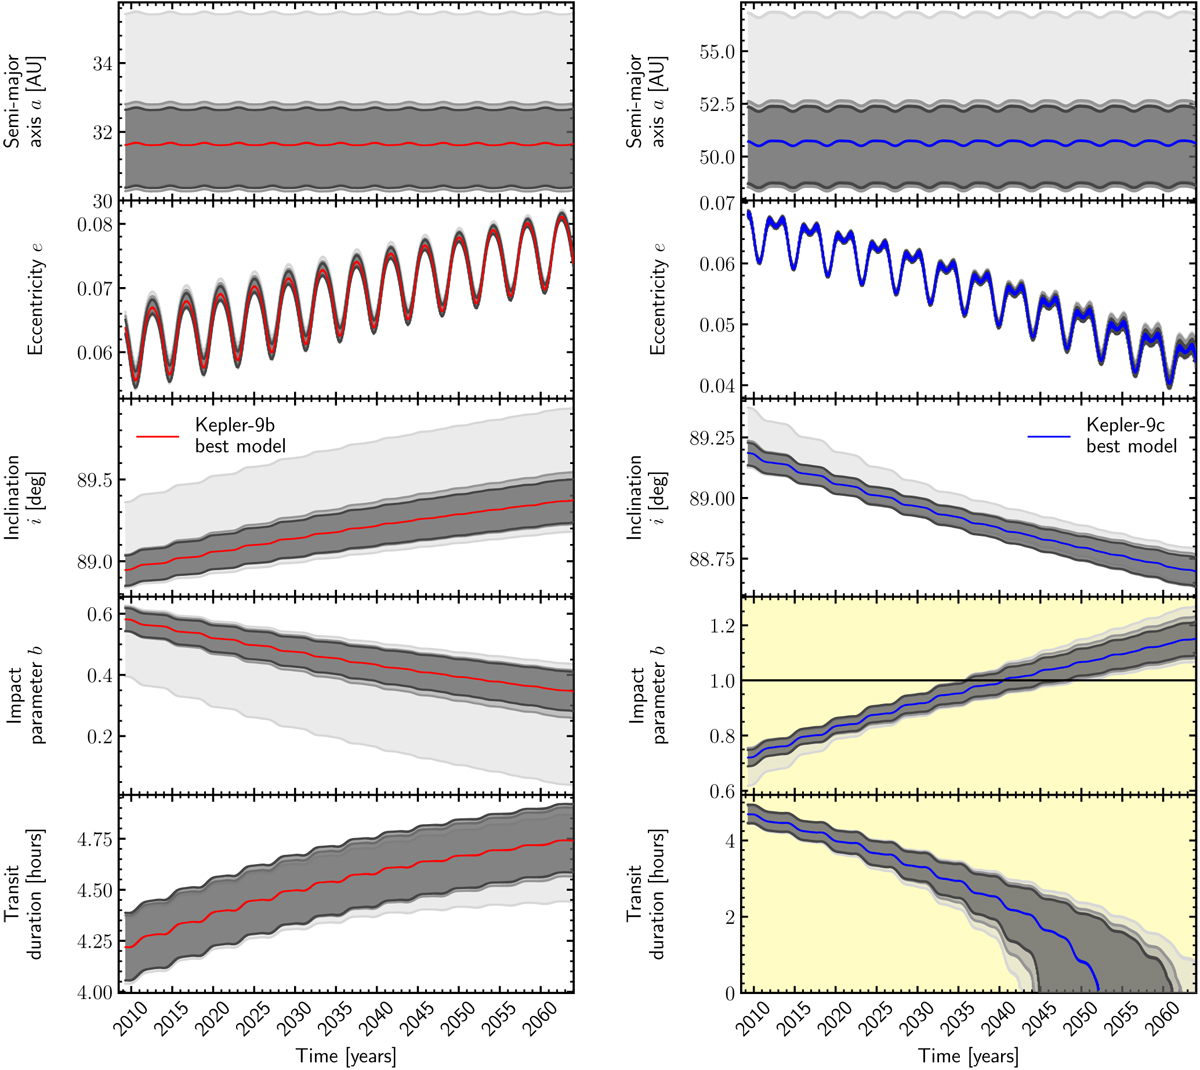
Top: extrapolation of the planets semi-major axis until 2065 for the best model for Kepler-9b (red, left) and Kepler-9c (blue, right). Grey areas show the 99.74% confidence interval of 1000 randomly chosen good models for the different data sets. From light to dark grey: modelling of data sets I, II, and III. Second from top: extrapolation of the planets eccentricity. Third from top: extrapolation of the planets inclination. Fourth from top: extrapolation of the calculated impact parameter. Bottom: extrapolation of the calculated transit duration. The background of the impact parameter and the transit duration is coloured to highlight the place where the prediction of disappearing transits comes from.
Current usage metrics show cumulative count of Article Views (full-text article views including HTML views, PDF and ePub downloads, according to the available data) and Abstracts Views on Vision4Press platform.
Data correspond to usage on the plateform after 2015. The current usage metrics is available 48-96 hours after online publication and is updated daily on week days.
Initial download of the metrics may take a while.