Fig. A.3
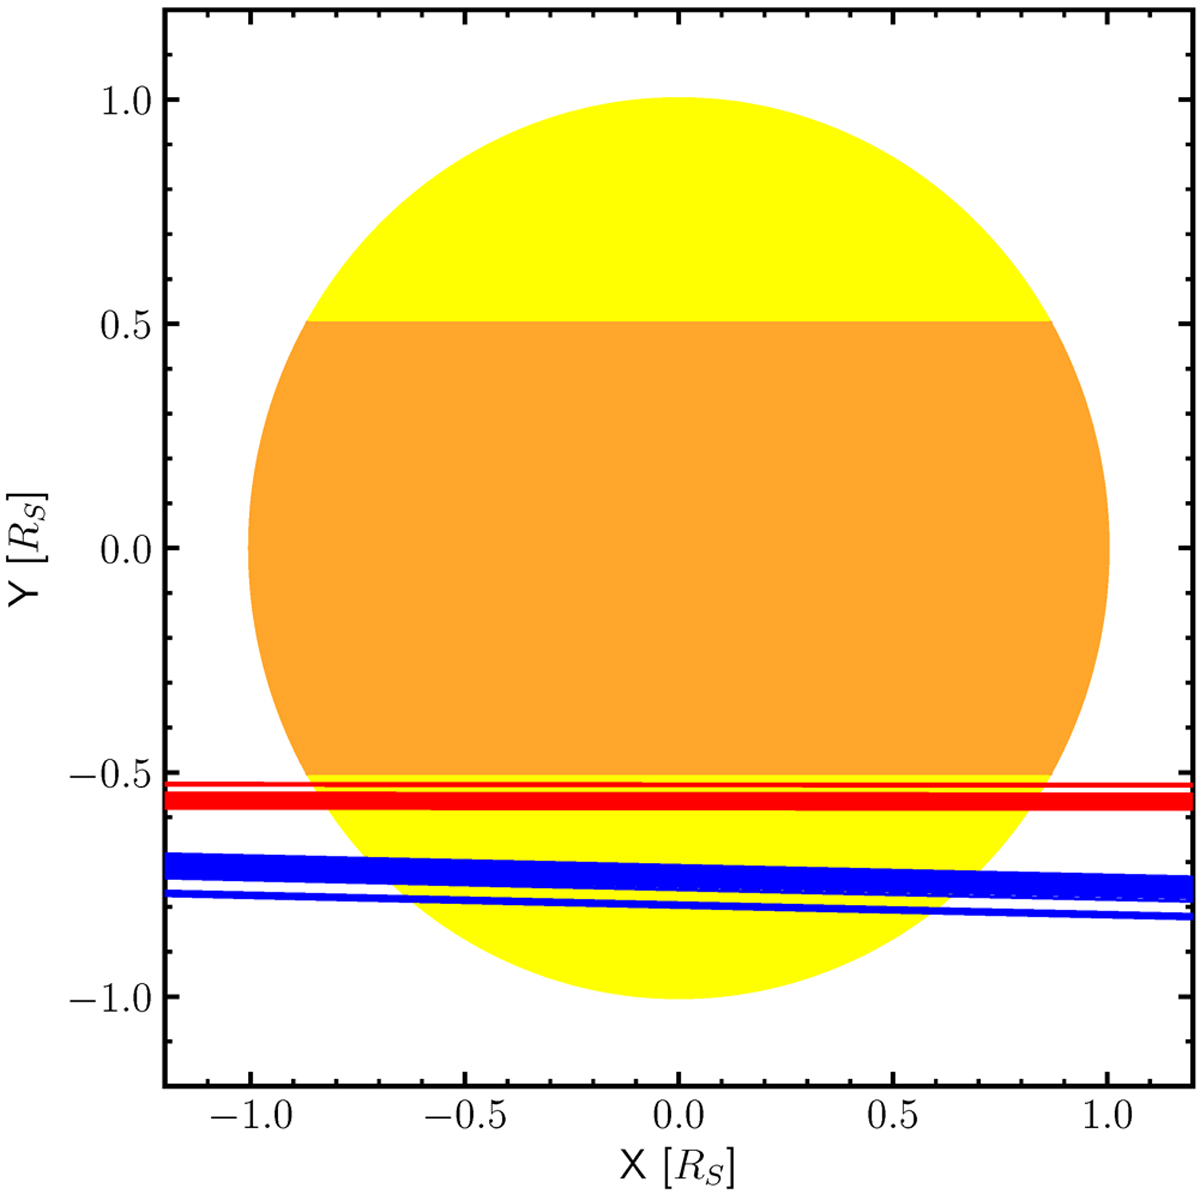
Latitude coverage of Kepler-9 (yellow circular disc) by all transit observations of data set III for Kepler-9b (red) and Kepler-9c (blue). Demonstrated is the best model of data set III. The order of the variations can be drawn from Figs. 5 or A.2, where the fourth row shows the modelled impact parameters. The orange area indicates the possible spot occurrence area between 0° and 30° up- and downwards.
Current usage metrics show cumulative count of Article Views (full-text article views including HTML views, PDF and ePub downloads, according to the available data) and Abstracts Views on Vision4Press platform.
Data correspond to usage on the plateform after 2015. The current usage metrics is available 48-96 hours after online publication and is updated daily on week days.
Initial download of the metrics may take a while.