Fig. A.1.
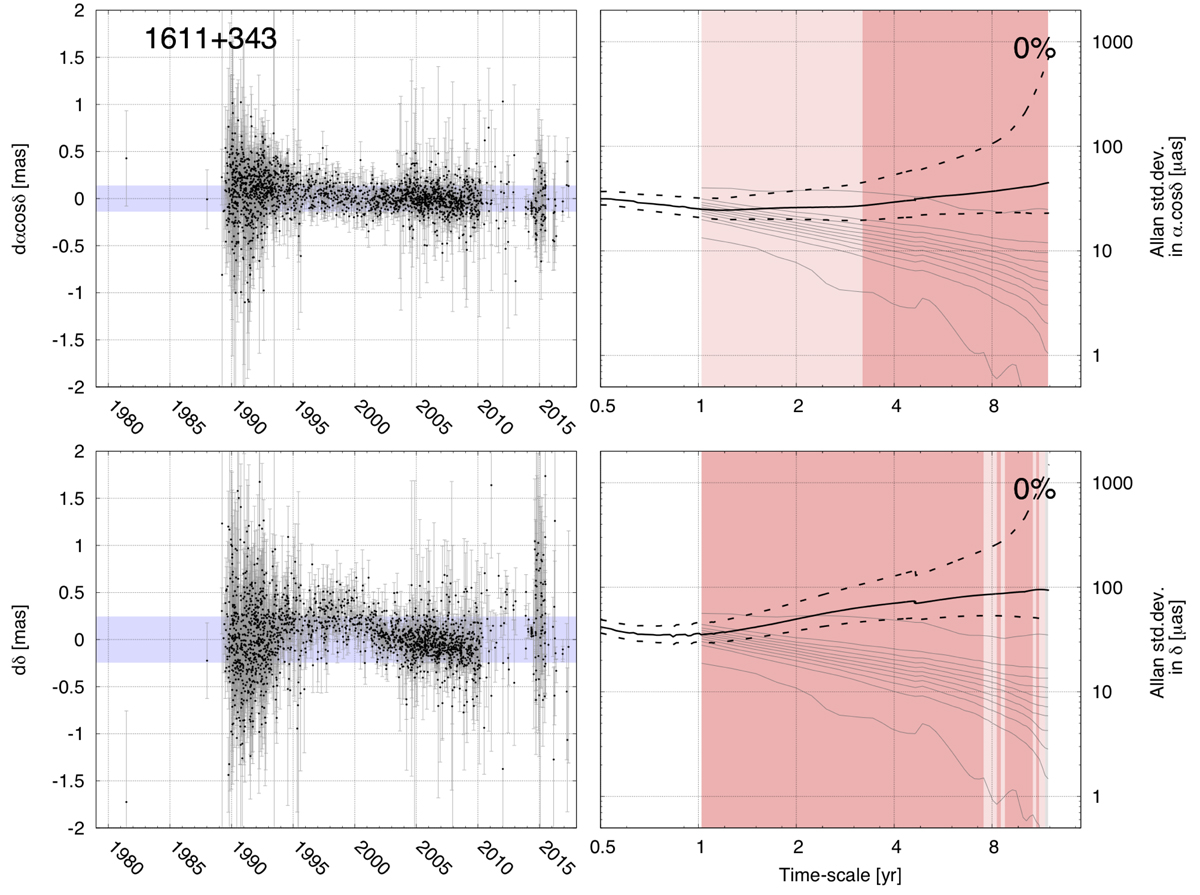
Additional examples as Fig. 1. Each four-quadrant plot shows (left panel) coordinate time series with their standard deviation given by the blue area and (right panel) the Allan standard deviation as a function of the averaging timescale (black solid line, see Eq. (1)), where the colored background indicates the behavior of the dominating noise (stable in gray, unstable in red, intermediate in pink), the black dotted lines represent the interval of confidence (at 90%) on the estimated Allan standard deviation at each timescale, and the gray lines represent the boundaries of deciles as computed from the Monte Carlo test (an explanation of the principle is given in Sect. 3.3 and additional information is provided in Sect. 3.4). The percentage in the top right corner gives the probability that the source is AV0.
Current usage metrics show cumulative count of Article Views (full-text article views including HTML views, PDF and ePub downloads, according to the available data) and Abstracts Views on Vision4Press platform.
Data correspond to usage on the plateform after 2015. The current usage metrics is available 48-96 hours after online publication and is updated daily on week days.
Initial download of the metrics may take a while.