Fig. 6.
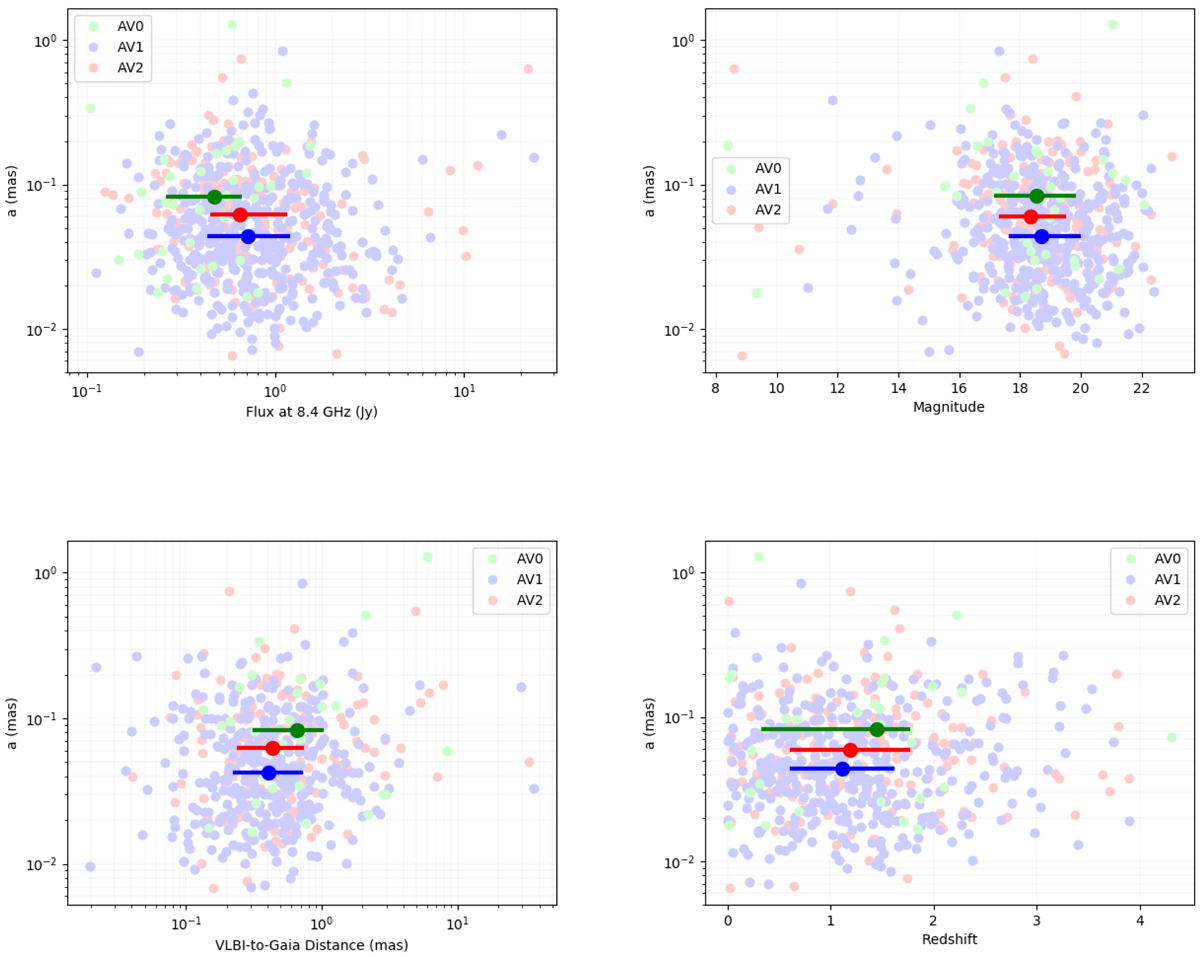
Comparison between the stability index a based on the LMWN and (top left panel) the flux at 8.4 GHz, (top right panel) the B magnitude, (bottom left panel) the radio-to-optical distance deduced from the comparison between the ICRF2 positions and Gaia DR1, and (bottom right panel) the redshift. The horizontal bars indicate the second (from the left extremity) and the third (to the right extremity) quartiles. The larger disk indicates the median.
Current usage metrics show cumulative count of Article Views (full-text article views including HTML views, PDF and ePub downloads, according to the available data) and Abstracts Views on Vision4Press platform.
Data correspond to usage on the plateform after 2015. The current usage metrics is available 48-96 hours after online publication and is updated daily on week days.
Initial download of the metrics may take a while.