Open Access
Fig. 4.
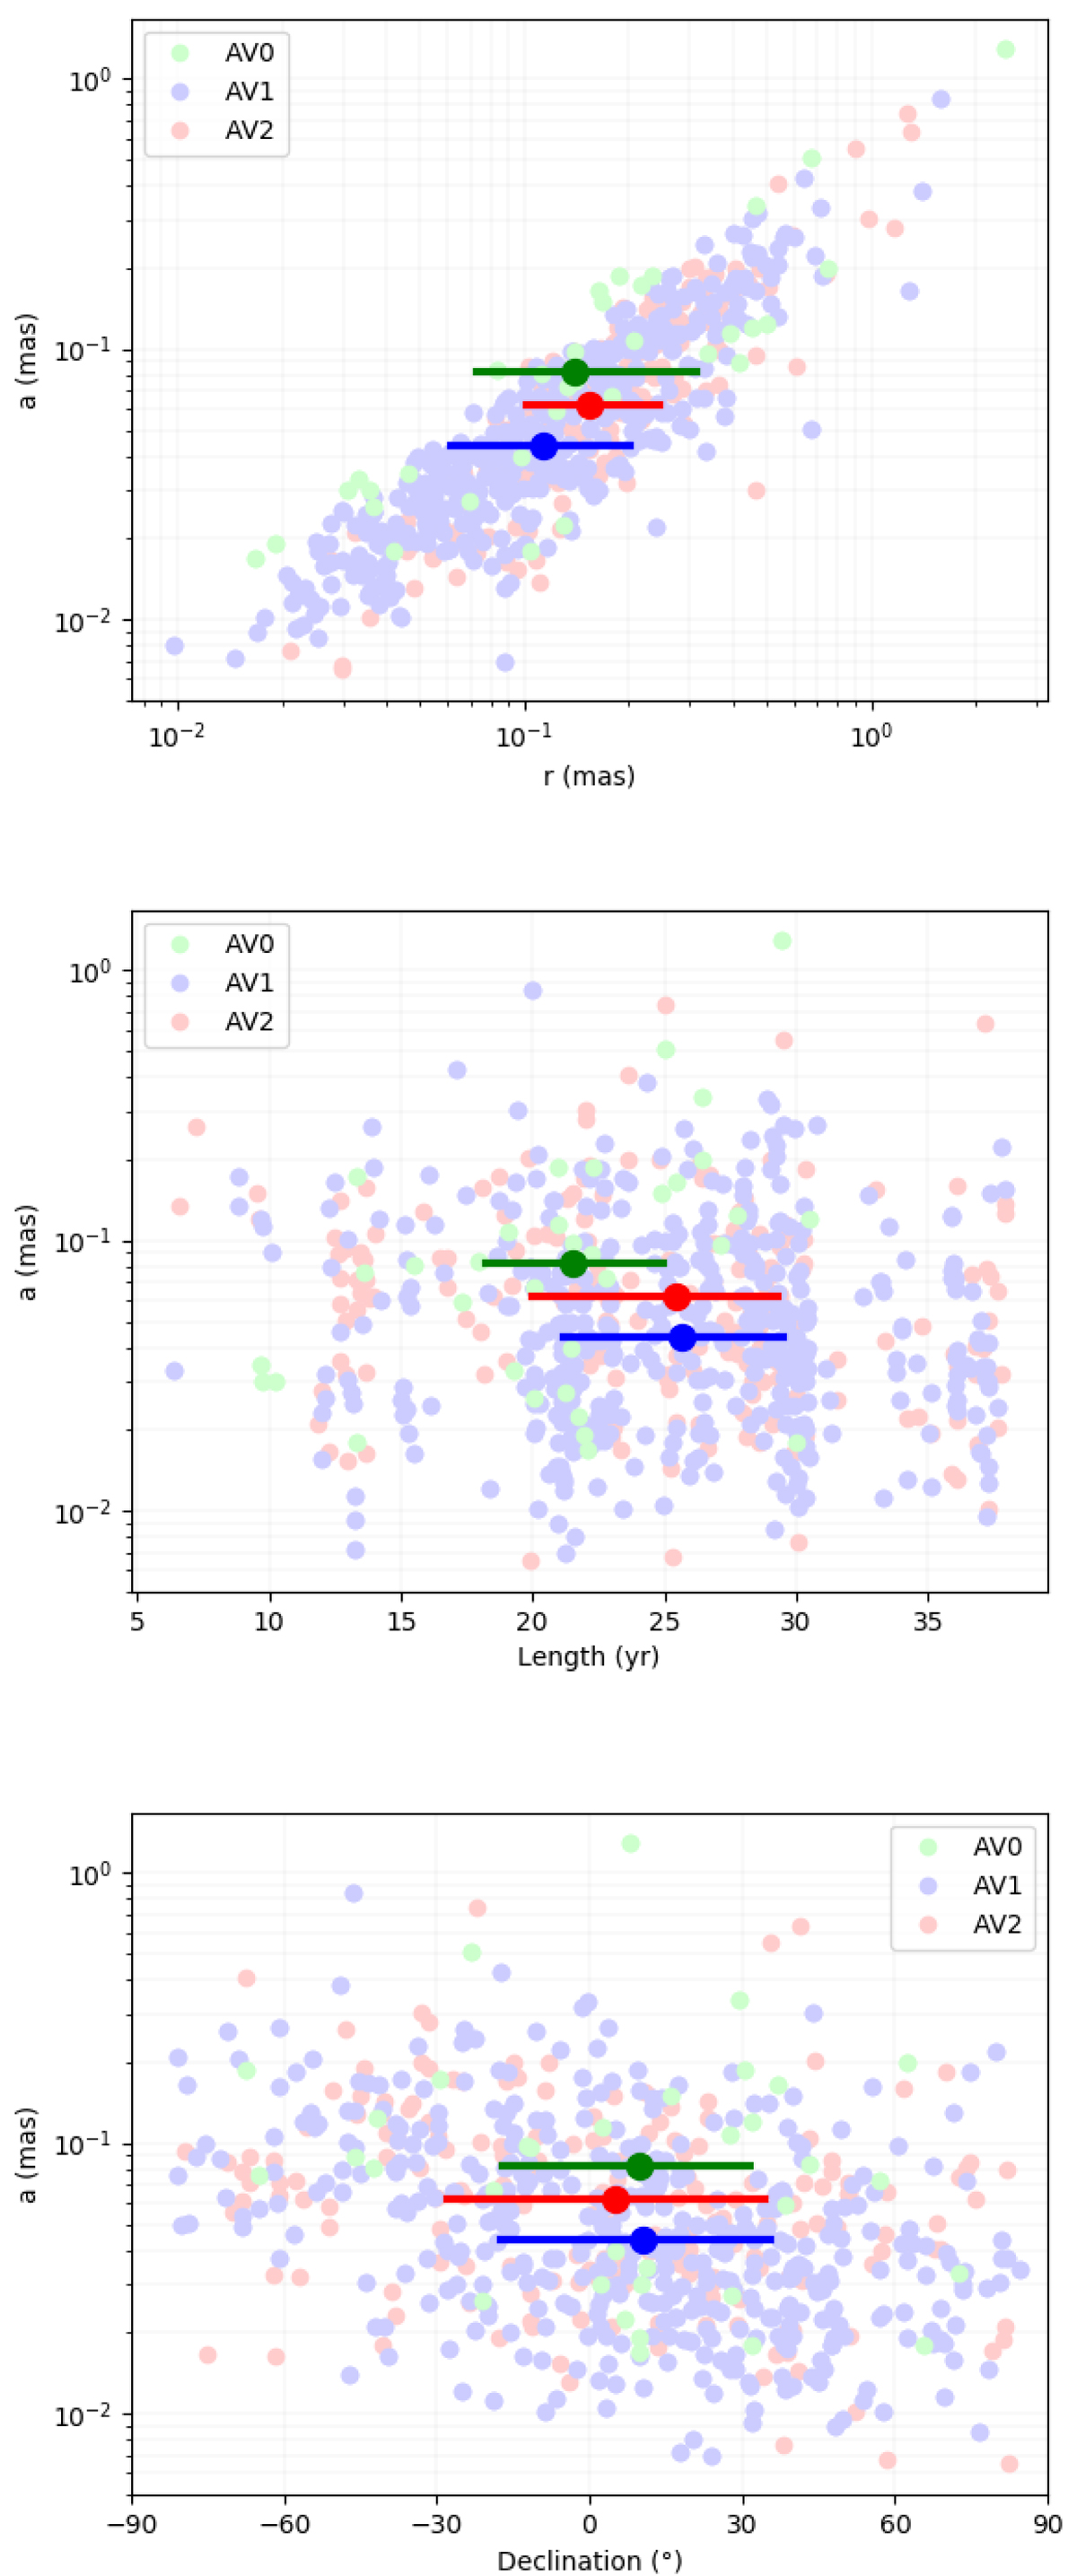
Comparison between the stability index a based on the LMWN and (top panel) the classical rms-based indice r (middle panel), the observation time span, and (bottom panel) the declination. The horizontal bars represent the first (left extremity) and the third (right extremity) quartiles. The larger disk indicates the median.
Current usage metrics show cumulative count of Article Views (full-text article views including HTML views, PDF and ePub downloads, according to the available data) and Abstracts Views on Vision4Press platform.
Data correspond to usage on the plateform after 2015. The current usage metrics is available 48-96 hours after online publication and is updated daily on week days.
Initial download of the metrics may take a while.