Fig. 5.
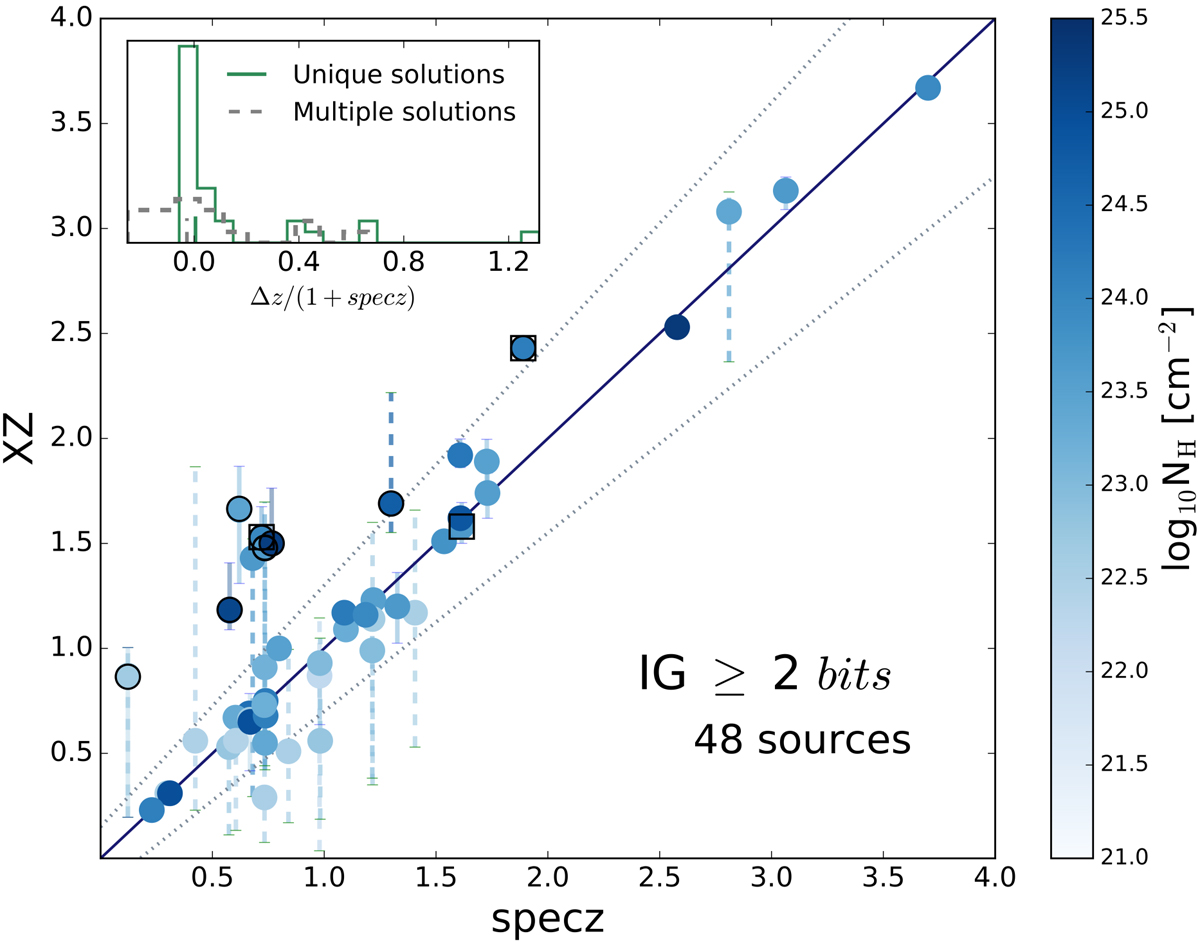
Comparison of XZ and specz for constrained cases (IG ≥ 2). The filled circles show the median of the XZ probability distribution while the error bars correspond to 1σ-equivalent quantiles and color-coded by the median of the obscuration level. Dashed error bars indicate XZ found multiple solutions. The black solid line shows XZ = specz, while the gray dotted lines show XZ = specz ± 0.15(1 + specz). Points outside this region and where the XZ error bars do not cover the specz value are circled in black. Square symbols show insecure specz values (Luo et al. 2017). The inset shows the relative difference between XZ and specz.
Current usage metrics show cumulative count of Article Views (full-text article views including HTML views, PDF and ePub downloads, according to the available data) and Abstracts Views on Vision4Press platform.
Data correspond to usage on the plateform after 2015. The current usage metrics is available 48-96 hours after online publication and is updated daily on week days.
Initial download of the metrics may take a while.