Fig. 4.
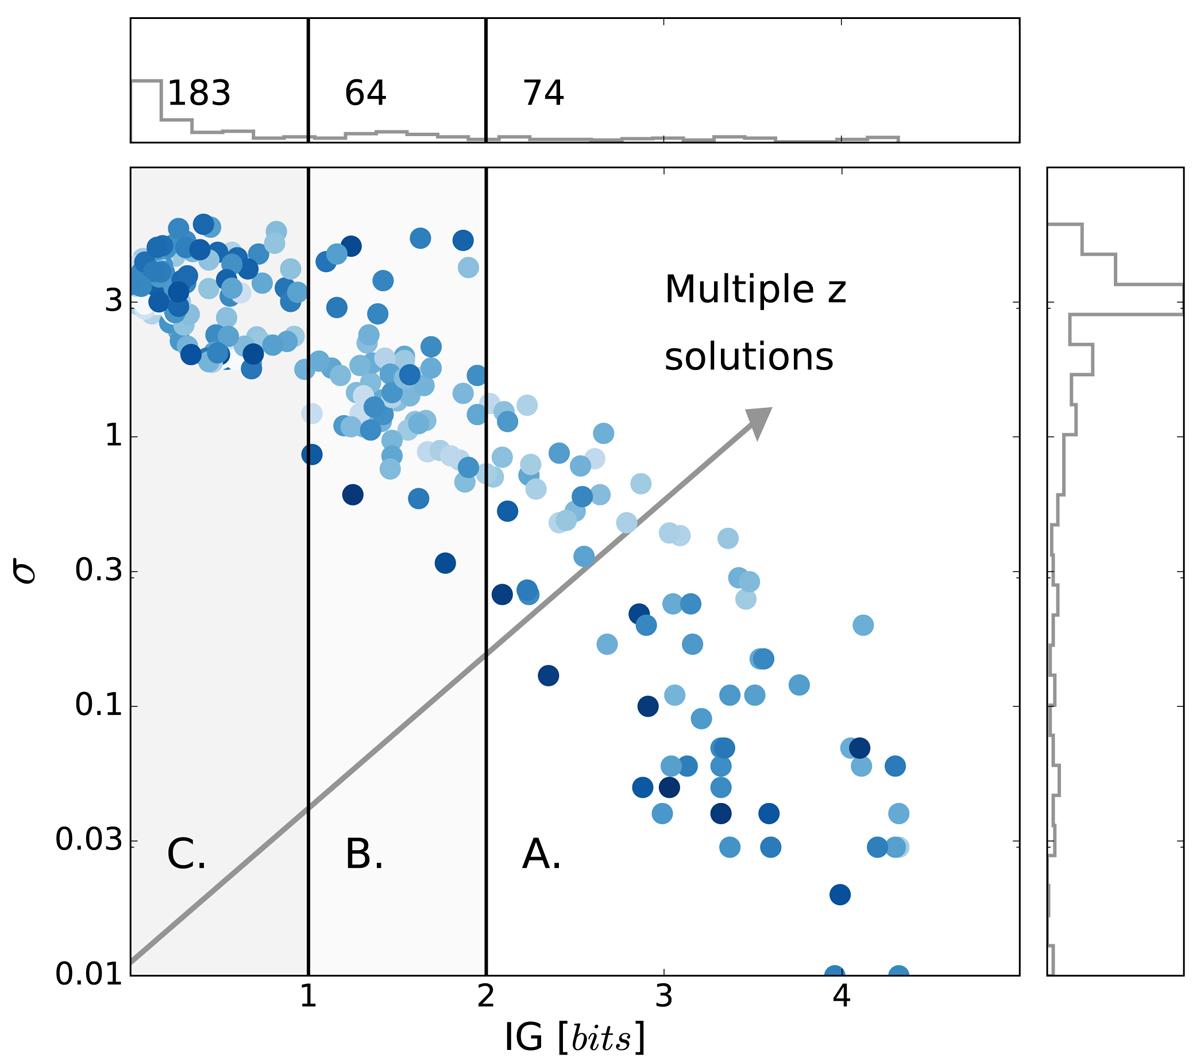
Comparison of two redshift uncertainty measures, the information gain (IG; x-axis) and the standard deviation σ(z) (y-axis). Generally, a larger σ(z) implies a smaller IG. However, the IG also captures multiple solutions (examples are shown in subsequent figures) which can inflate the simple σ(z) measure (symbolized by the gray arrow). The color-coding indicates the obscuration (median of uncertainties); darker colors represent higher column densities. Heavily obscured sources typically have only a single solution and are at lower σ. The vertical lines delimit three regions, A (IG ≥ 2 bits, “constrained redshift”), B (1 ≤ IG < 2 bits, “has redshift information”), and C (IG < 1 bit, “no redshift information”). The top and right panels show normalized histograms.
Current usage metrics show cumulative count of Article Views (full-text article views including HTML views, PDF and ePub downloads, according to the available data) and Abstracts Views on Vision4Press platform.
Data correspond to usage on the plateform after 2015. The current usage metrics is available 48-96 hours after online publication and is updated daily on week days.
Initial download of the metrics may take a while.