Fig. 3.
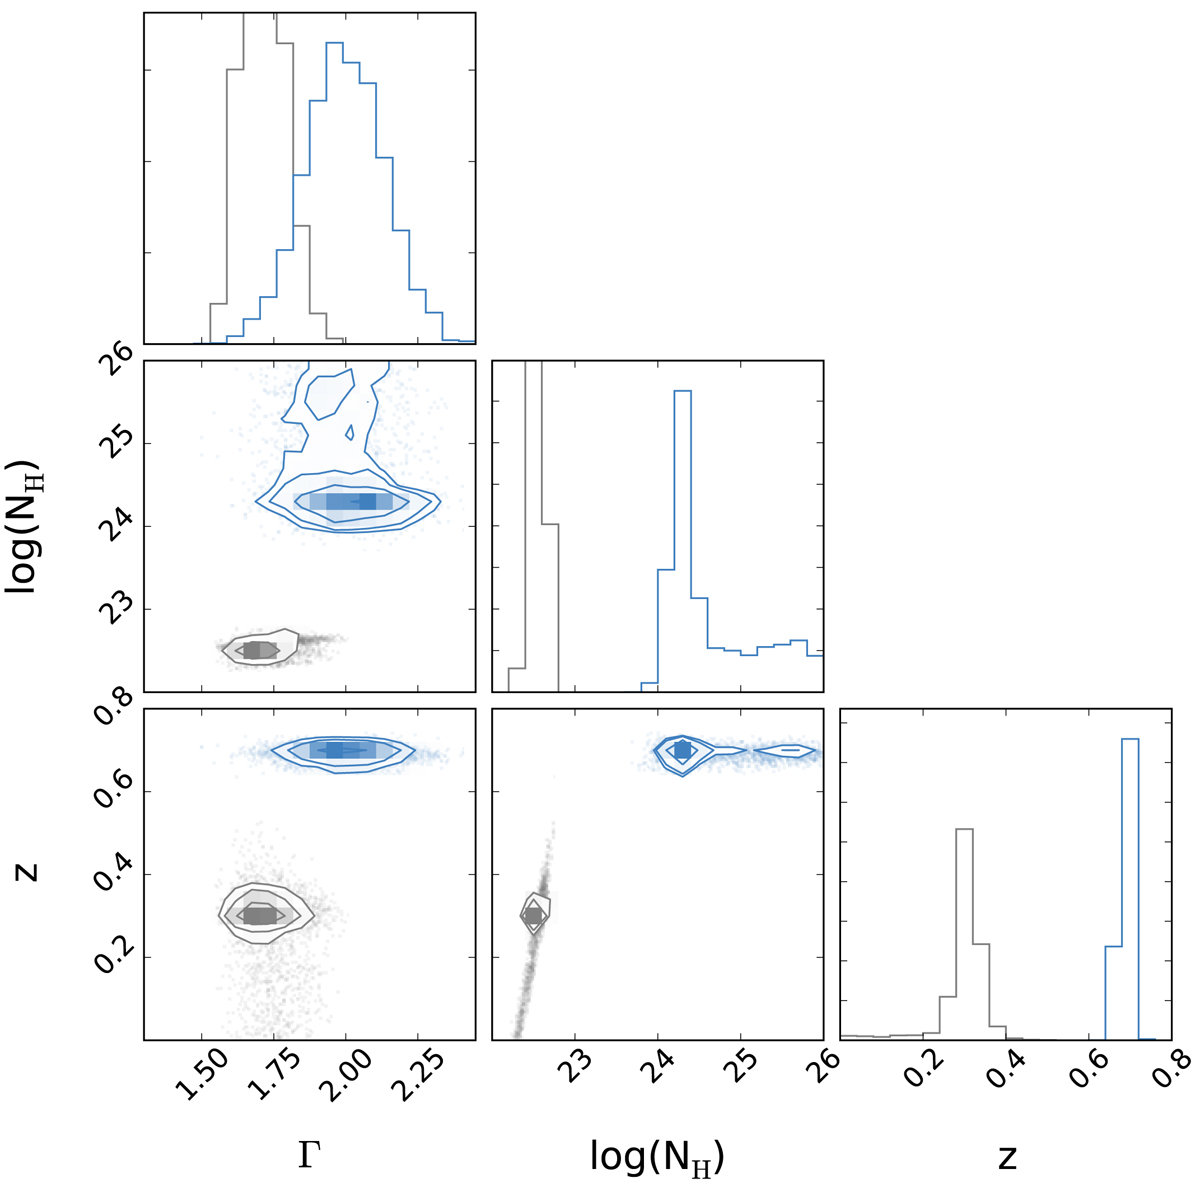
Corner plot showing the parameter space over photon index, column density, and redshift for the heavily obscured AGN R65 (blue) and the mildly obscured AGN R4 (gray), see Fig. 2. Contours indicate 1, 2, and 3σ uncertainties. Any posterior samples outside are plotted as gray dots. Bottom right panel: shows the marginalized redshift probability distribution. In the bottom middle panel a modest degeneracy between column density and redshift is present for R4.
Current usage metrics show cumulative count of Article Views (full-text article views including HTML views, PDF and ePub downloads, according to the available data) and Abstracts Views on Vision4Press platform.
Data correspond to usage on the plateform after 2015. The current usage metrics is available 48-96 hours after online publication and is updated daily on week days.
Initial download of the metrics may take a while.