Fig. 15.
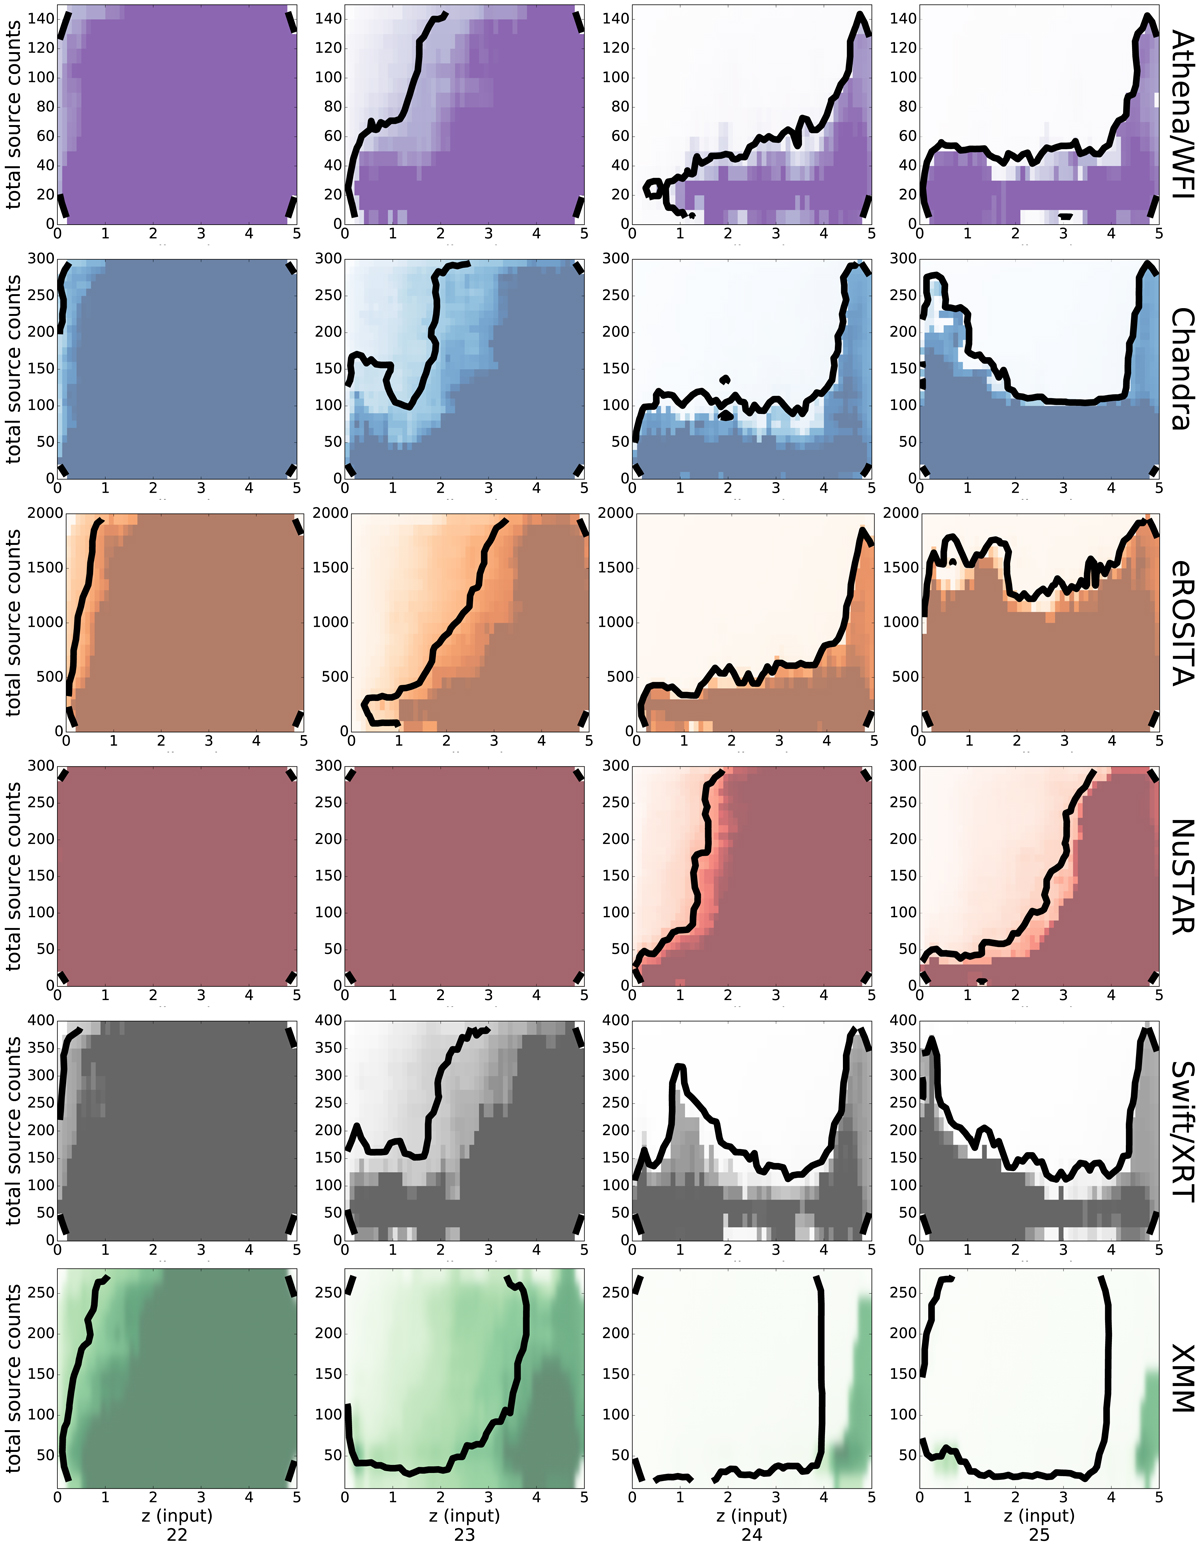
Sensitivity heat maps for each instrument. Redshift uncertainty (colors) are plotted against source redshift (x-axis) and total source counts (y-axis). Above the thick contour lines, IG > 1 bit, i.e., the number of counts is sufficient to provide some redshift information. From left to right panels, the columns show log NH = 22, 23, 24, and 25 cm−2. XMM total source counts refer to total counts across PN/MOS1+2.
Current usage metrics show cumulative count of Article Views (full-text article views including HTML views, PDF and ePub downloads, according to the available data) and Abstracts Views on Vision4Press platform.
Data correspond to usage on the plateform after 2015. The current usage metrics is available 48-96 hours after online publication and is updated daily on week days.
Initial download of the metrics may take a while.