Fig. 14.
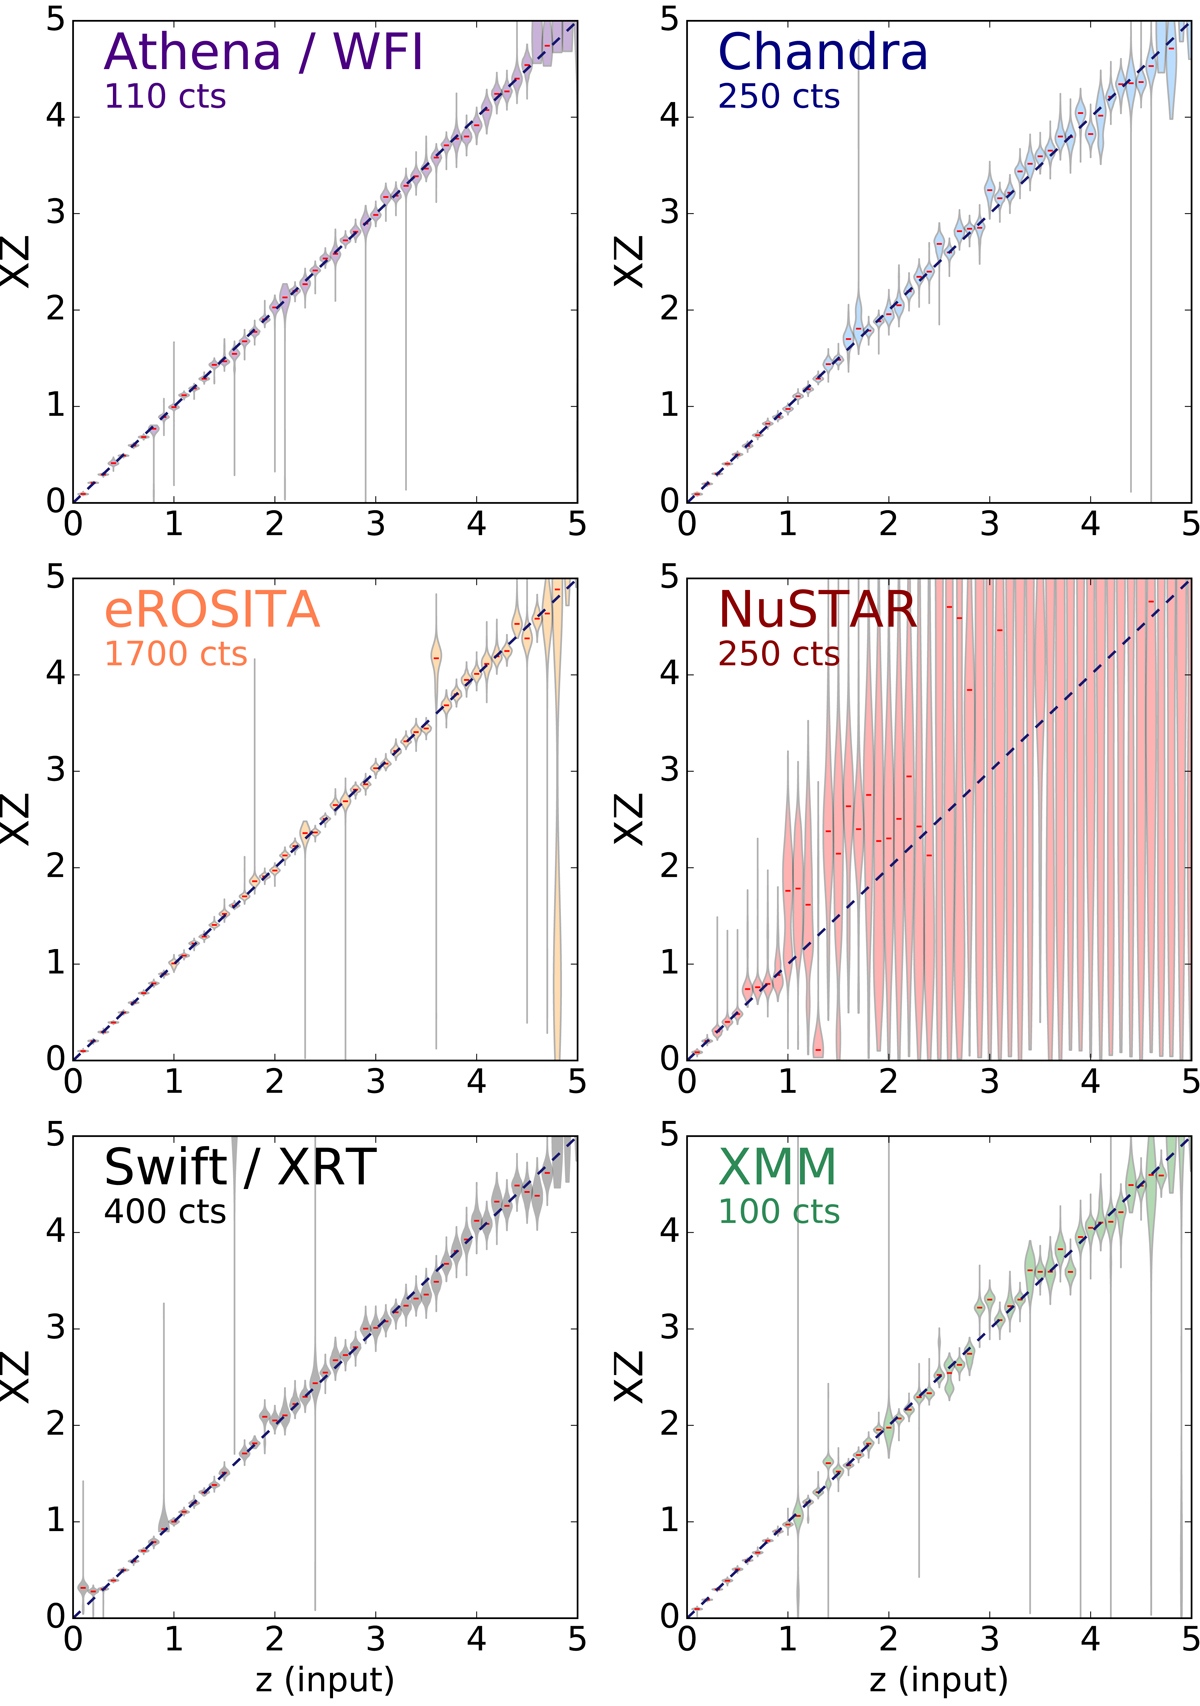
Recovery of redshifts by the XZ method. Output XZ redshift probability distributions are shown as violin plots for each input z (x-axis). In all cases NH = 1024 cm−2 is shown. The panels correspond to different instruments, with a total number of source counts chosen at the approximate threshold where the XZ method starts to work optimally.
Current usage metrics show cumulative count of Article Views (full-text article views including HTML views, PDF and ePub downloads, according to the available data) and Abstracts Views on Vision4Press platform.
Data correspond to usage on the plateform after 2015. The current usage metrics is available 48-96 hours after online publication and is updated daily on week days.
Initial download of the metrics may take a while.