Fig. 11.
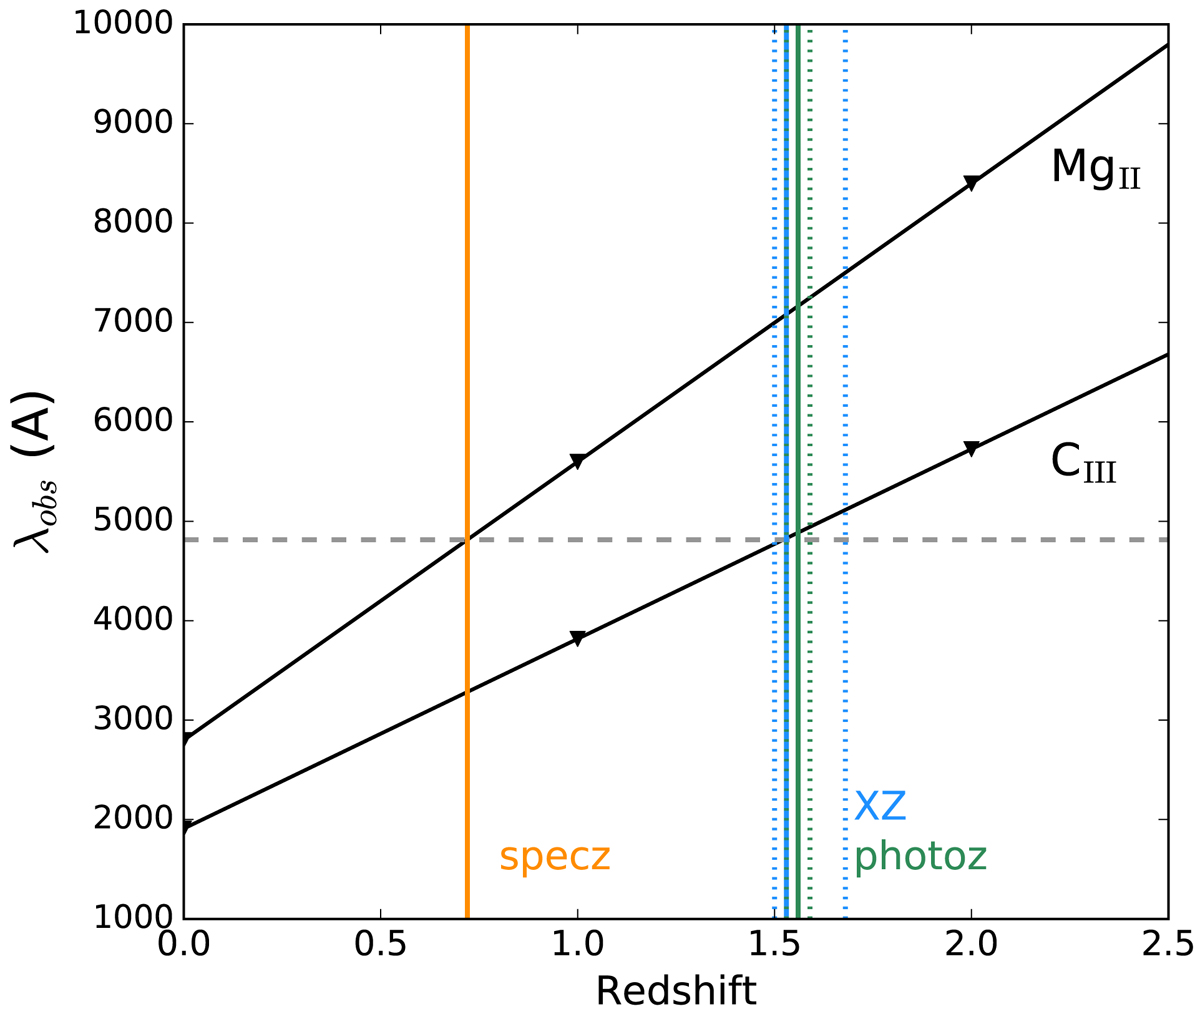
Observed wavelength of MgII and CIII spectroscopic lines as a function of redshift. The horizontal dashed line shows the observed wavelength of a single detected optical spectral line in source R446. The vertical lines indicate the reported specz (orange), photoz (green), and XZ (blue). The dotted vertical lines show the errors of photoz and XZ, respectively. The specz was derived assuming MgII, but agrees with XZ and photoz if we assume CIII instead.
Current usage metrics show cumulative count of Article Views (full-text article views including HTML views, PDF and ePub downloads, according to the available data) and Abstracts Views on Vision4Press platform.
Data correspond to usage on the plateform after 2015. The current usage metrics is available 48-96 hours after online publication and is updated daily on week days.
Initial download of the metrics may take a while.