Fig. 5.
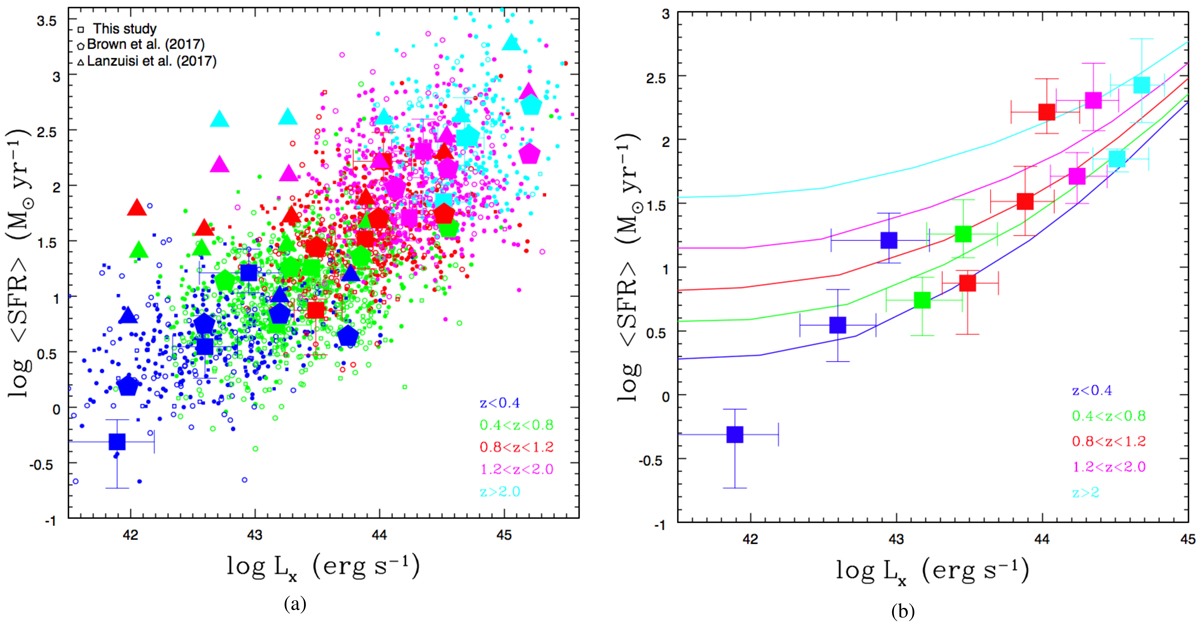
Left panel: distribution of AGN X-ray luminosity vs. SFR. Dots show individual AGN. Sources with photoz are shown by empty points and specz sources by filled points. AGN with available Herschel photometry are presented with squares, and those without Herschel data by circles. Large squares refer to our binned results (median SFR and LX values are shown, in bins of SFR), and the error bars represent the 1σ dispersion of each bin. Triangles and polygons show the results from Lanzuisi et al. (2017) and Brown et al. (2018), respectively. The symbols are colour-coded based on their redshifts, z > 0.4 blue, 0.4 < z < 0.8 green, 0.8 < z < 1.2 red, 1.2 < z < 2.0 magenta, and z > 2.0 cyan. Right panel: distribution of AGN X-ray luminosity vs. SFR. Squares present our binned results. The solid lines show the extrapolated trends from Hickox et al. (2014). They are colour-coded based on their redshift range.
Current usage metrics show cumulative count of Article Views (full-text article views including HTML views, PDF and ePub downloads, according to the available data) and Abstracts Views on Vision4Press platform.
Data correspond to usage on the plateform after 2015. The current usage metrics is available 48-96 hours after online publication and is updated daily on week days.
Initial download of the metrics may take a while.