Fig. 3.
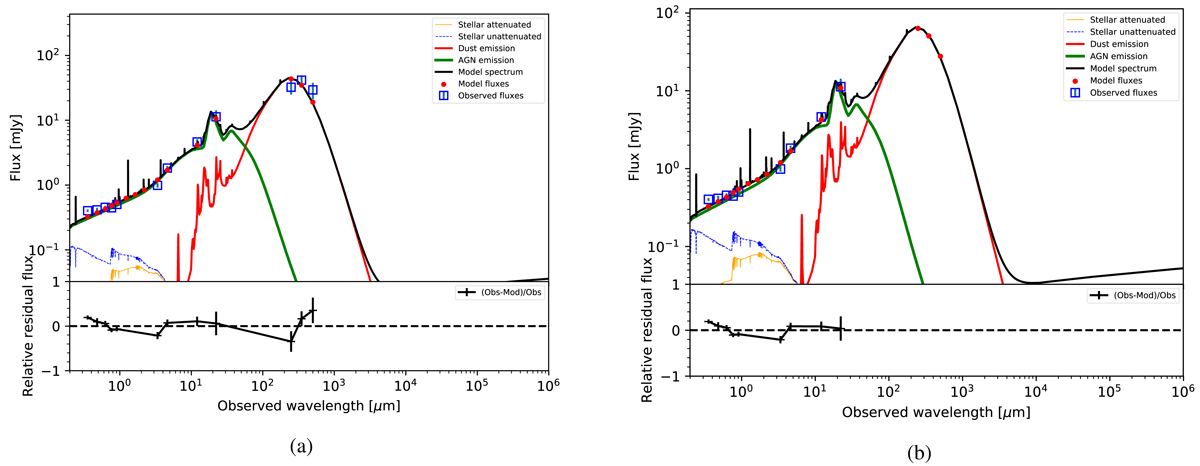
SED fitting of an AGN with (left panel) and without (right panel) Herschel photometry. The star formation component is plotted in red, the AGN component in green, and the attenuated and the unattenuated stellar component is described by the yellow and the blue dashed line, respectively. The black solid line shows the best fit from CIGALE. The source lies at z = 0.986. When far-IR photometry is included in the fitting analysis, CIGALE yields ![]() , log SFR = 2.49 M⊙ yr−1 and M⋆ = 10.94 M⊙. Without Herschel, the corresponding values are
, log SFR = 2.49 M⊙ yr−1 and M⋆ = 10.94 M⊙. Without Herschel, the corresponding values are ![]() , log SFR = 2.28 M⊙ yr−1, and M⋆ = 11.05 M⊙.
, log SFR = 2.28 M⊙ yr−1, and M⋆ = 11.05 M⊙.
Current usage metrics show cumulative count of Article Views (full-text article views including HTML views, PDF and ePub downloads, according to the available data) and Abstracts Views on Vision4Press platform.
Data correspond to usage on the plateform after 2015. The current usage metrics is available 48-96 hours after online publication and is updated daily on week days.
Initial download of the metrics may take a while.