Fig. 9.
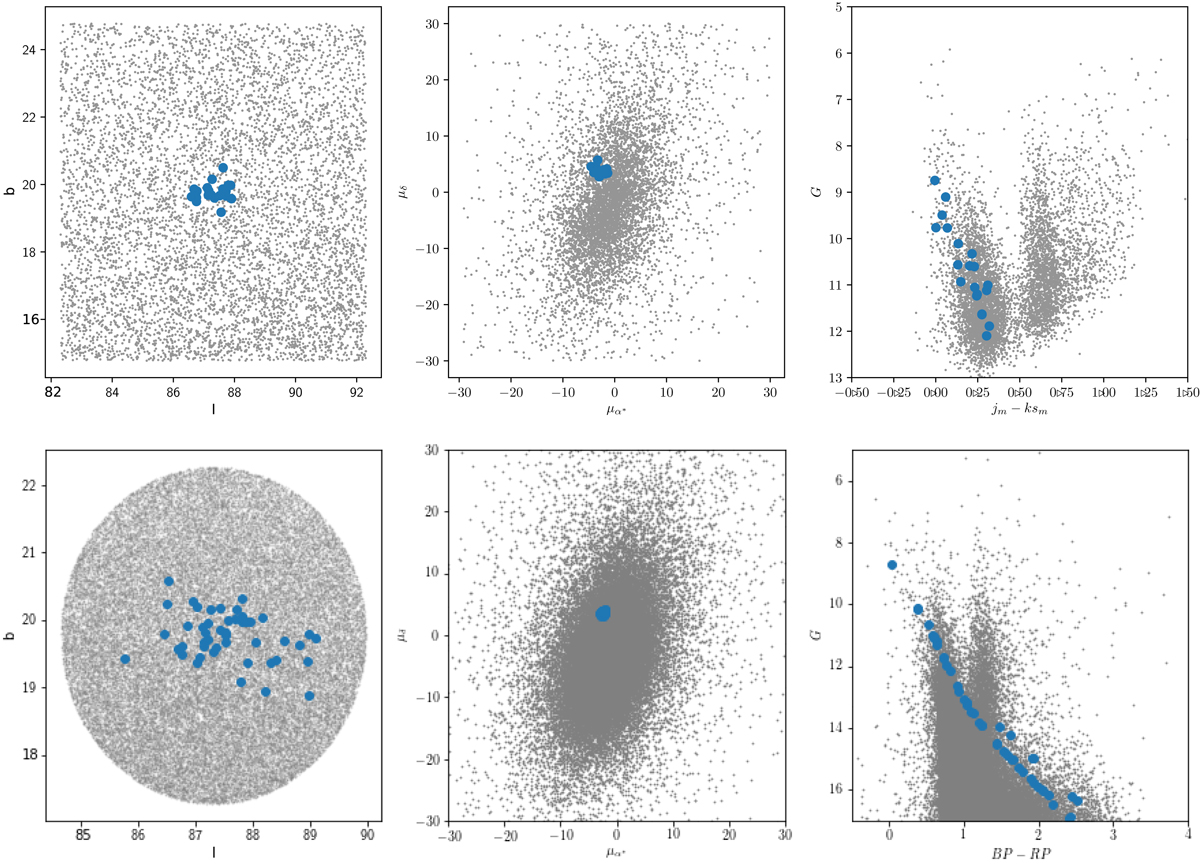
Visualisation of UBC1 from Table 1. Top panels left plot: position of the member stars (blue) along with field stars (grey) in a 10 deg × 10 deg area in TGAS data. Middle plot: same stars in the proper motion space. Right plot: CMD of the stars in the field using photometry from Gaia and 2MASS; member stars follow an isochrone. Bottom panels: equivalent for Gaia DR2 data. The major difference is in the CMD, where the members detected in Gaia DR2 are clearly following an isochrone due to the better quality of the photometric Gaia data.
Current usage metrics show cumulative count of Article Views (full-text article views including HTML views, PDF and ePub downloads, according to the available data) and Abstracts Views on Vision4Press platform.
Data correspond to usage on the plateform after 2015. The current usage metrics is available 48-96 hours after online publication and is updated daily on week days.
Initial download of the metrics may take a while.