Free Access
Fig. 8.
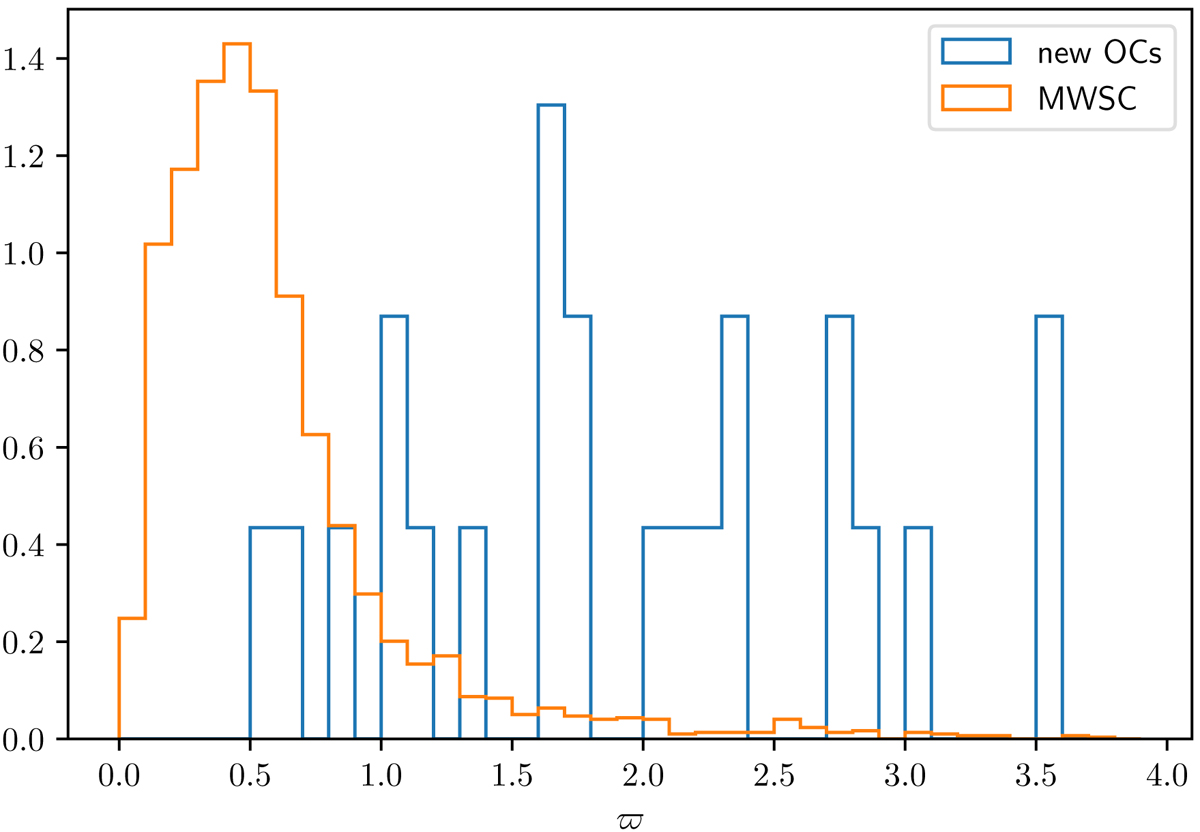
Normalized parallax distribution of the found OCs (blue) and the ones listed in MWSC (orange). The newly detected OCs are closer than most of the catalogued clusters in MWSC.
Current usage metrics show cumulative count of Article Views (full-text article views including HTML views, PDF and ePub downloads, according to the available data) and Abstracts Views on Vision4Press platform.
Data correspond to usage on the plateform after 2015. The current usage metrics is available 48-96 hours after online publication and is updated daily on week days.
Initial download of the metrics may take a while.