Fig. 7.
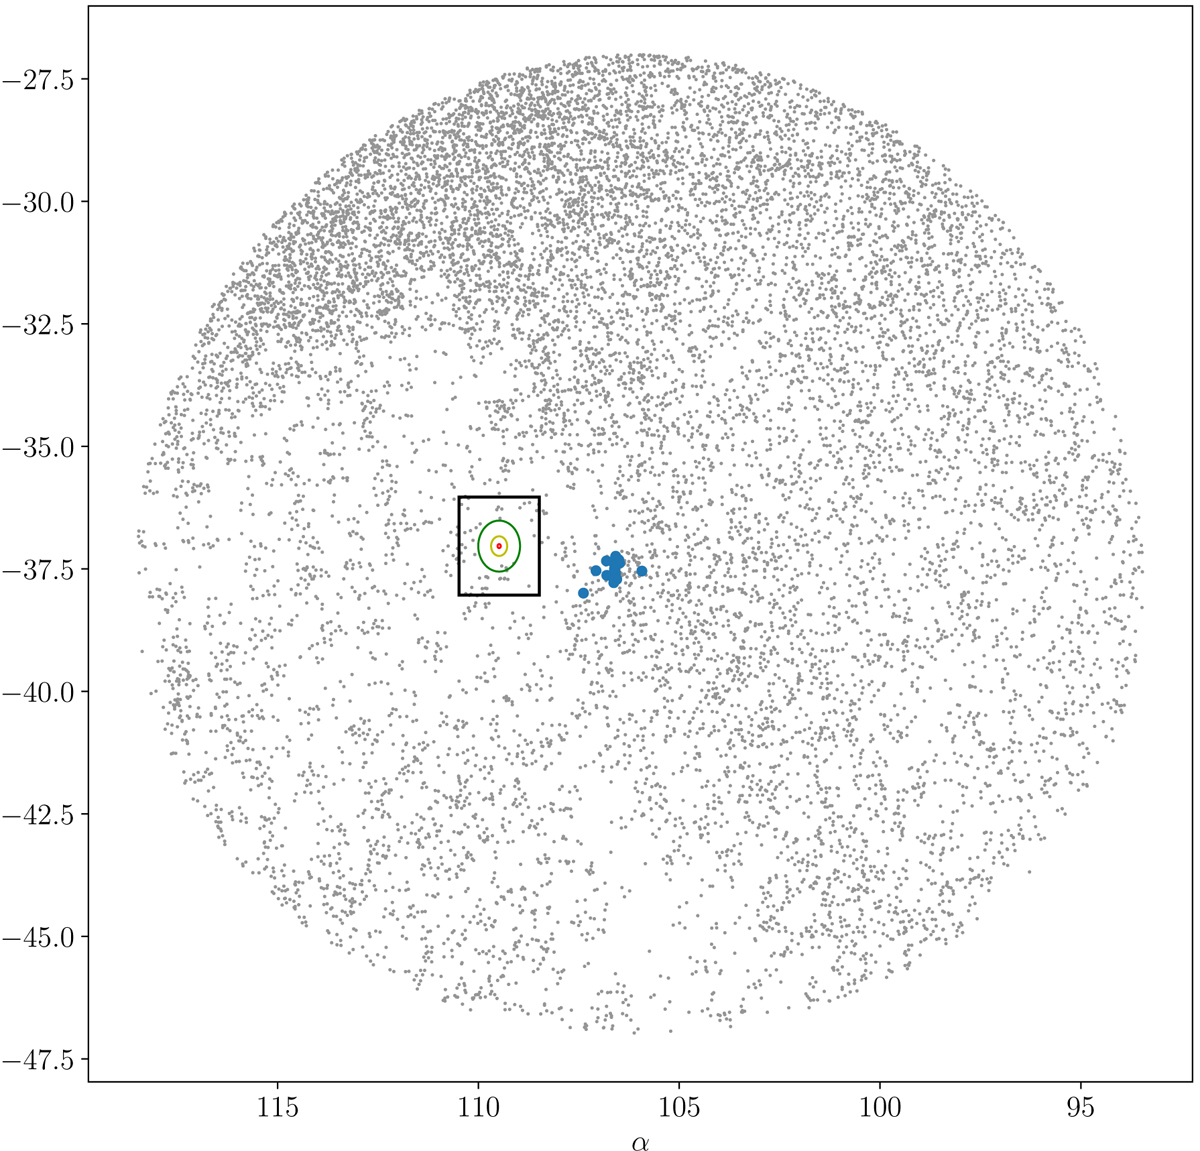
Cone search of 10 deg centred in UBC7 in the TGAS data with more than 120 photometric observations. Blue dots represent members of UBC7. The red, yellow, and green circles represent the r0, r1 and r2 radius in the MWSC catalogue for Collinder 135. The black box is the 2 deg × 2 deg zone where all candidate clusters are considered as known clusters. The visible stripes on the data are due to the Gaia scanning law.
Current usage metrics show cumulative count of Article Views (full-text article views including HTML views, PDF and ePub downloads, according to the available data) and Abstracts Views on Vision4Press platform.
Data correspond to usage on the plateform after 2015. The current usage metrics is available 48-96 hours after online publication and is updated daily on week days.
Initial download of the metrics may take a while.