Fig. 6.
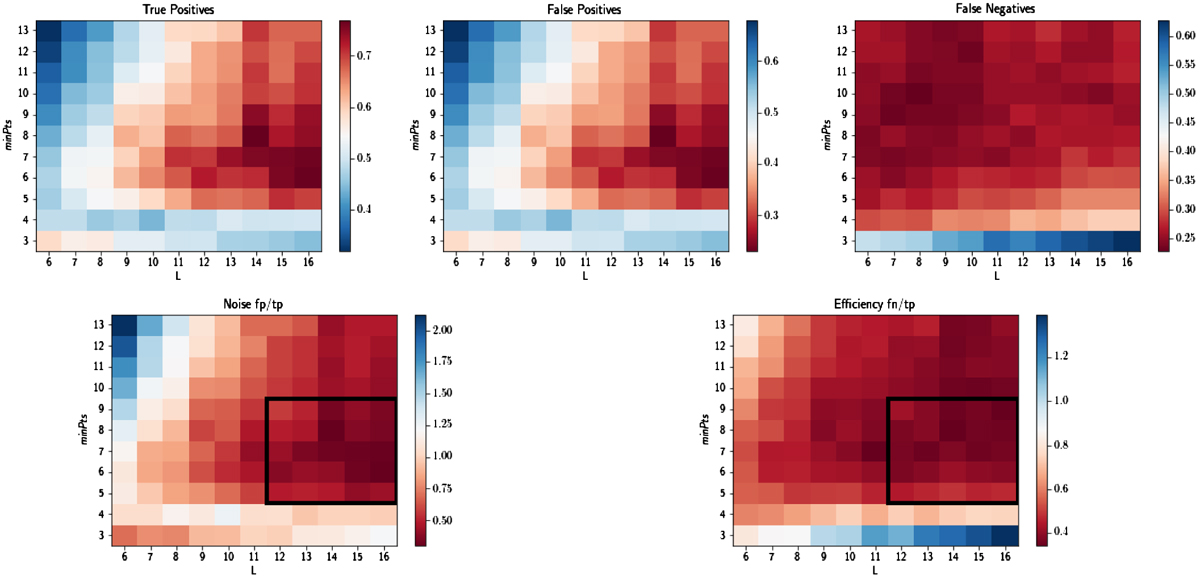
Performance of the algorithm with a different set of parameters (L, minPts) tested with simulated data. Top panels: true positive (left), false positive (middle), and false negative (right) rates. We highlight the inversion of the colour bar in the true positive rate to always represent the reddest pixels as the best performing pair of parameters. Bottom panels: noise (left) and efficiency (right). The black box encloses the area of pixels corresponding to the selected pairs of parameters.
Current usage metrics show cumulative count of Article Views (full-text article views including HTML views, PDF and ePub downloads, according to the available data) and Abstracts Views on Vision4Press platform.
Data correspond to usage on the plateform after 2015. The current usage metrics is available 48-96 hours after online publication and is updated daily on week days.
Initial download of the metrics may take a while.